Financia; Reports

Financial Reports: A Primer

Imagine you are unwell, and go to the doctor for a check-up.  The doctor does a preliminary analysis, and orders some tests. Upon reading the results he declares that your condition is peachy, and yes you can go ahead and play that friendly tennis match this weekend.  The situation is similar to how companies perform in a competitive scenario too. Only you have the annual reports to peruse to figure out the chances of the company being able to hold out on the field.

Now the annual reports are generally published by all listed companies. While private companies also have to disclose their audited financial statements to the ROC (Registrar of Companies), most of them are not available in the public domain. Let’s take a deeper look into the financial reports and understand the various parts that make them up and what each of them mean.

[Disclaimer: This article is meant for those who are new to subject, have been previously daunted by some of the financial jargons, or otherwise just stayed away because of a general apathy towards anything finance related! ]

General Corporate Information

This tells us about the various aspect of the Board of directors, the Senior management, the ethos that drives the company, Vision and Mission statements. Introduces you to the various subsidiaries and what each of them does, and how they play a role in the overarching strategy of the company, the various rewards and recognitions that the company has received over the course of the year and so on.

Annual Highlights

This section tells you of the exciting things that are happening in the space, or within the company. What were the new launches, how were they received by the audience. Was there a new acquisition? If so how does the company plan to extract the synergies between the companies? Everything you need to read to know what the company stands for and where they are going.

Management’s Discussion And Analysis

2020 will be a great year to look forward to this section. Because a lot of companies have had to fundamentally rejig the way they operate and run their businesses. This section entails all the major decisions taken, in response to both external and internal stimuli. What was the impact of those decisions, how they expect the business outcome to be, projected earnings and all that and more.

Financial statement

Now we finally come to the numbers. There are 3 types of financial statements: the income statement which tells how well the company operated in the financial year; the Balance Sheet which tells you about the assets and liabilities of the company as on the date of preparing it; and finally the Cashflow Statement which accounts for the flow of cash in and out of the business in the financial year.

Let’s take a closer looks at each of the 3 and understand what we should be paying attention to in each of these by using the FY20 report of Reliance Industries as an example.

Warren Buffet can’t emphasize enough on the importance of these 3 statements, and firmly believes that you have no business investing in the stock market if you can’t read them. These numbers can tell us if the company has a sustainable competitive advantage. And how can one gauge this? By looking for a consistency in revenues, consistently low debt, consistently growing earning, consistent low capital expenditures etc.

So let’s see what these numbers tell us, shall we?

i. The Income Statement

The income statement is a summation of the revenues and expenses incurred by a company in a specific time period, in this case annually.

Now the first item we see is the revenue line item. We subtract the cost of goods sold, and other operating expenses along with Depreciation here to arrive at operating income or EBIT.

When we subtract interest payments and taxes we arrive at the PAT or net income.

Now what are some of the things to look out for in the income statement? First for me would be the Net income of the company. Has it been growing steadily over a period of time, say 10 years? Here we can see that it has grown 17% over last year, which indicates a strong underlying business.

Next we come to Gross margin, which is the operating income upon Revenues. According to Buffett, widely accepted as the father of value investing this should be upwards of 40%. Another good practice would be to compare gross margins with competitors. How does the company fare with respect to the rest of market? This will give us a good idea of the moat that the business has managed to build. A high gross margin is desirable because it indicates greater scalability. More you sell more profitable you make.

Then another metric I like comparing over a period of years is the Net margin= net income/Revenue; Ideally a steady margin of above 10% is preferable. In here we see that its around 9%.

Income Statement

iI. The Balance Sheet

One of the first things I look for in a balance sheet if the Retained Earnings. This tells me if company reinvests net income back into the company, or not. Ideally this should be growing steadily, meaning that the business is profitable and is able to identify good reinvestment opportunities. Sometimes companies take part in expensive dividends and share repurchase programs, the outflow of which effects the retained earnings. Which is the case in Reliance. As on March end 2016 they had a retained earnings to the tune of Rs.4,480 crores. However after aggressive dividend pay-out and acquisitions of multiple companies into its fold.

The next few metrics can be measure by using both the Balance sheet and income statement. The first of which is Return on Equity= Net Income/Total Equity. This indicated whether or not the company has a durable competitive advantage. In Reliance’s case 8%, whereas that of the O2C industries is at 8% and Telecom at 4%. So that probably explains why Reliance is all set to pivot out of O2C into telecom.

Next let’s look at Return on Net Tangible Assets= Net income/Total tangible asset. In adverse situations, can your income more than cover your assets which are needed for the smooth functioning of the firm? This metric helps us understand the durability of the company.

And finally some leverage ratios. Long term debt should be low, ideally a company should be able to repay all its long term debt with 5 years net income. Reliance, which is virtually a net debt free company, stands in good stead on that dimension. Then we come to Debt to equity, which tell us how is the capital employed in the company. Lower the ratio better. In ideal scenarios this should not be beyond 2.

Balance Sheet

III. The Cashflow Statement

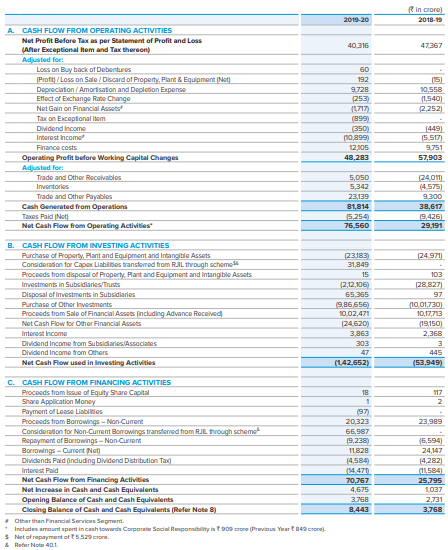
The cashflow statement and income statement are different from each other in that the cashflow statement represents actual ins and outs of money, while the income statement is a measure of financial performance.

Now one of the parameters to look at is Free cashflow= cashflow from operations – capex; We shall come to capex in a little bit. But first what can we understand from Free cashflow? This tells us, after all the activities of the firm are taken care of, how much money is left in the hands of corporate entity. This allows the company to pursue activities for benefit of shareholders, like acquire other companies, pursue R&D efforts or simply redistribute back to the shareholders.

However for Reliance this was a negative Rs. 1.1 Lakh crore. Now what does a negative FCF mean and is it a cause for concern? Reliance has expedited the investments in upcoming technology, like 5G, Jio Platforms etc, all which required significant cash. Also they had made a slew of acquisitions, adding new consumer tech companies under their umbrella. And finally they have been strategizing to turn net debt free by 2023 and hence a lot of the cash generated went towards clearing of older debts.

Now let’s cover Capex which we spoke of a while ago. Capital expenditure= change in Plant, Property and Equipment over last year – Depreciation;

This is the money spent on plant, machinery etc. Things we should look for are what percentage of net earnings is capex? This should be low <25% very good, <50% acceptable. If by chance it is large like Reliance, what is the company using the money for? Is it to acquire crucial bandwidth to grow their Jio business? Or for 5G related tech infrastructure? In which case because they are building to be future ready it is acceptable.

Cashflow Statement
Cashflow Statement (1)

And so those were some of the basic things to look at before you start investing in a company.

Of course this was just the tip of the ice berg and there are a lot of other nuances to reading the financial statements. In case you are interested, I would strongly urge you to read “The Interpretation of Financial Statement” by Ben Graham, “Common Stock and uncommon Profits” by Phil Fisher, two of the books which inspired this article. In addition to get a deep insight into some of the best investment decisions, and how the masters arrived at it, please do read Berkshire Hathaway’s Letters to Shareholders from 1965 onwards.

Follow Us @

Some Unrelated Stories!

Leave a Comment

Your email address will not be published. Required fields are marked *