Bull and Bear Market with Stock Market bakground

Market Chronicles

Market Chronicles for the week ended 22nd January 2020.

Nifty50 ended the very volatile third week of Jan 0.43% in the red, after giving up ~370 points from the high. We believe that some profit booking is natural at this level, given that the Union Budget is approaching, and investors wish to take some money off the table ahead of the potential volatility.

However, the uptrend is intact, and hence we see no cause to be outright bearish. Thereby our outlook is CAUTIOUSLY OPTIMISTIC, until such budget related uncertainty is out of the way. We expect stocks to remain volatile throughout next week.

If you’re new to technical analysis and would like to know how to read the charts below, here’s a quick guide! https://www.investopedia.com/trading/candlestick-charting-what-is-it/

Big Boys

So far in January, FIIs net bought 21007 cr of stock, while DIIs net sold 15759 cr of stock.

Source: StockEdge

Please read on to understand our rationale. This article contains an analysis of technical parameters as well as open interest and derivatives data. All the information below has hints for what levels to watch out for in weekly trade. Replicating these on your charting software and keeping an eye on them can help minimize unpleasant shocks in your trading.

Note: Our directional views are subject to sudden and drastic change mid-week. For anyone who wants a daily update on the stock markets, we suggest you follow us on Twitter, for some more frequent insights. Our handles are @anoshmodyy and @MarketsWithKR

The daily and hourly charts have some key support levels marked, to be watched in case of a deeper correction.

Moving Averages

A quick snapshot of how the major Moving Averages are placed on the daily chart. Worth noting how 20 MA arrested the fall with ease.

(Red = 200 MA; Purple = 100 MA; Blue = 50 MA, Yellow = 20 MA)

Ichimoku (D)

Ichimoku (W)

Bank Nifty

Bank Nifty achieved a fresh ATH this week, before plummeting lower. The RSI divergence on the daily chart is playing out.

Bank Nifty vs Nifty (Relative Strength Chart)

The bank index crumbled lower, and is now headed towards a major CIP level where it is likely to find support.

Nifty Midcap 100

The midcap index is clinging to its previous ATH, with the RS chart refusing to decisively breakout just yet. Will be interesting to see how things go for midcaps here on out

Nifty SmallCap 100

Smallcaps have great catchup potential with midcaps, as the index is still ~30% below its previous high. The RS chart is ready to breakout of an Inverted Head and Shoulders pattern.

Nifty 500

The broad market measure of Indian stocks has also had a very extended rally, and the RS chart looks breakout ready. However, the sessions before the budget can be volatile, and a decisive breakout above this level is needed to take a call on outperformance.

Currency and Yields

DXY

The DXY has had quite a fall after breaching 92, but is now showing signs of revival. A dollar rally can hurt equities as an asset class, and this is one major cause for concern going forward.

USDINR

The currency pair does not seem immediately keen to breach the short term support at ~72, and has been unable to give a proper follow-through to the breakdown from the long term trendline. Can consolidate at this level for a while.

US 10 yr Government Bond Yield

Historically low yields are what helped in part fuel the global rally in equities, and a rising US10Y can be a threat to that rally.

India 10 yr Government Bond Yield

Yields in India seem steady, and sideways for now. Reassessment upon the break of current range!

OI Analysis:

Open interest or OI is the total number of open positions in the market. A high OI indicates that there is a lot of activity in that instrument. It does not indicate buyers and sellers individually but is instead a more holistic measure, i.e. it is the number of contracts between the buyers and sellers, not the buyers and sellers on their own. One of the ways OI analysis works is that high-volume market participants would have sold strangles at strikes which leads to higher OI. This type of reading does not typically account for other types of spreads that one may trade, but the data for it is available.

Nifty

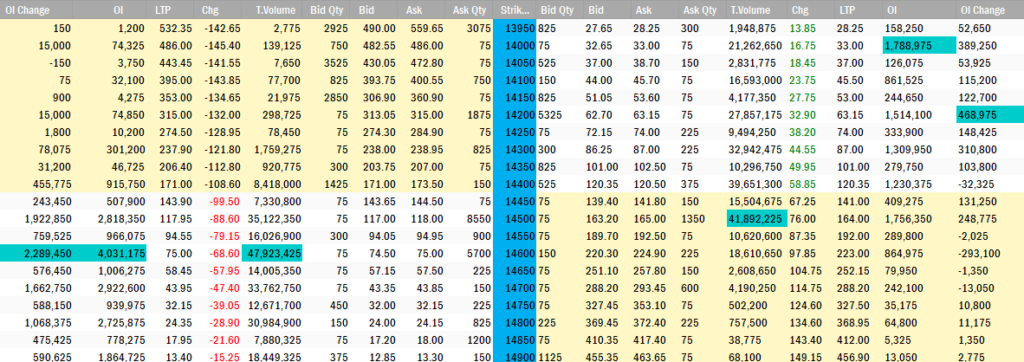
Friday’s sharp fall has resulted in a very interesting shift in Nifty OI. In the AM session on Friday, highest put OI was still around 14,500. However, the dip must’ve wiped out several put writers and hence we are seeing highest OI at 14,000 with a large addition in contracts at around 14,200.

Strictly speaking, this may indicate that larger players are not ruling out a further correction, possibly owing to damaged sentiments and pre-budget volatility amidst earnings season.

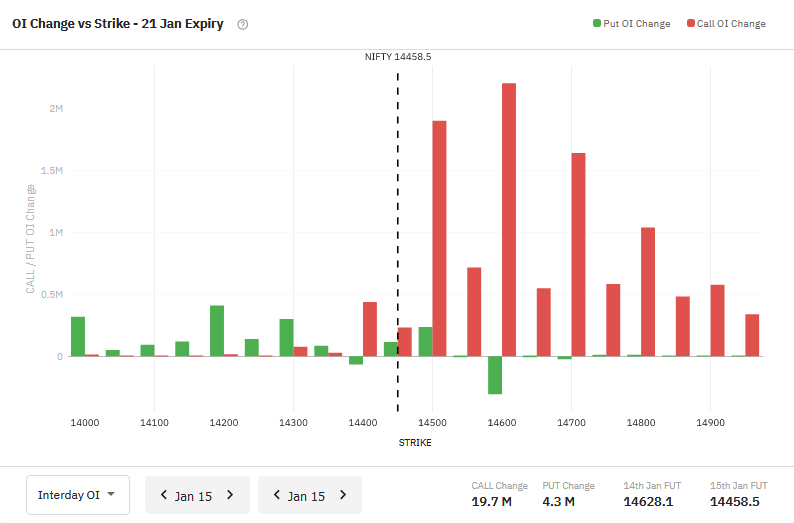
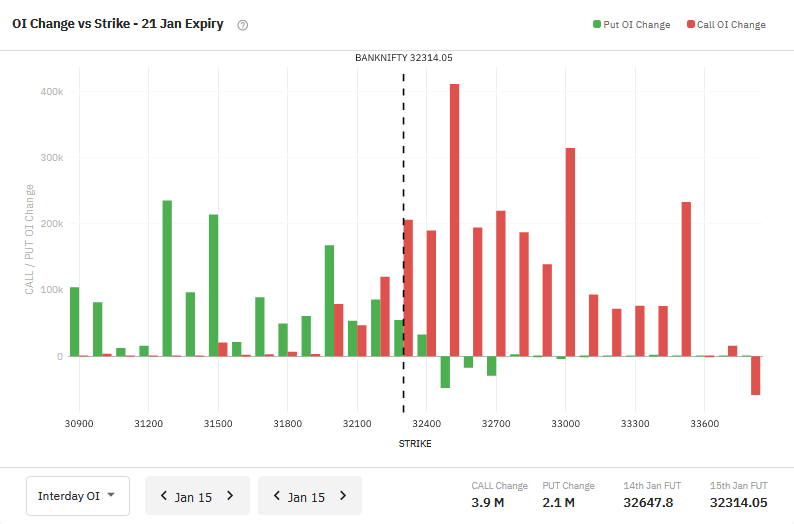
OI at each strike (graph below, data from Sensibull) shows just how negative the data has become compared to last week.

Important to note that while negative data is a bearish sign, it might not lead to Nifty moving a certain way, it purely shows how the outstanding contracts and change in contracts estimates Nifty to move.

Bank Nifty

Friday’s fall seems to have brought put writers back to sub-31,500 levels on Banknifty. This could be due to very weak performance by most banks except SBIN.

Like Nifty, there’s a clear bearish change in data. To see how last week’s OI was vis-a-vis this week’s, check this tweet.

Heavyweights in the Nifty 50:

Let’s look at some important stocks in Nifty50 that collectively make up around 42.40% of NSE’s flagship broad market index. This figure is lower than last month’s which means that the weightage occupied by the top five stocks has reduced. A significant change is that Reliance is back at the top, HDFC Bank is now #2! Infosys has also moved up one place, coming in at #3.

On the chart front, we’ve used naked charts, for the most part, to display the price action better.

1. Reliance Industries: The heavyweight continues consolidating around 50MA and is above 200MA. Strong delivery volumes may indicate that there is significant activity going on in RIL ahead of earnings. Important to note that due to a sharp fall, on a real-time basis RIL is no longer Nifty’s most weighted stock, but we follow the monthly NSE circulars. (Read the Basics of Dow Theory and trend by clicking here).

2. HDFC Bank: After breaking out of the resistance zone, HDFC Bank appears to be retesting it again. As long as these levels are held, the stock should remain bullish. Let’s not forget that the Q3 earnings are not far away and will have a major role to play in whether this level is respected or not.

3. Infosys: After the first consolidation breakout, Infy appears to be consolidating once again. This time, it took gap support on Friday. The IT sector as a whole was quite weak despite very strong results by TCS, Infy, Wipro and HCL Tech. This may be a sectoral sentiment more than anything. A likely scenario if Infy is unable to take support at the marked level is as gap filling and test of ~1275.

4. HDFC: Turned back from under 2800 levels and appears to be retracing now. HDFC was in fact one of the top draggers for Nifty. Even when other stocks were holding up well, HDFC dragged the index down throughout this week effectively. The chart below shows a retracement which indicates that a move upto 2530 cannot be ruled out.

5. ICICI Bank: The bank was very weak after creating a fresh ATH today. It appears uneasy above 540 and may test 535 or lower levels before smart money finds it an attractive proposition again. Along with HDFC, ICICI was another stock which was quite weak on Friday.

Heavyweights in Banknifty:

The number one mover is HDFC Bank, which has already been spoken about in the previous section, so we will discuss two other important stocks here, namely Kotak Bank and SBI. Other banks have an impact on the index, but these along with ICICI Bank are typically the movers.

1. Kotak Bank: Kotak Bank is at its FIB support (when drawn from most recent swing high). If respected, it could test 1900+ again, but intraday price action suggests very strong selling around that level. In case the FIB is broken, an 1800 retest should be important for the stock to lean on as it is a good support as marked.

2. SBIN: Drawing SBI D chart’s FIB from pre-COVID swing high, we can see that 304 FIB is acting as a support. Previously we spoke about the stock at 250 levels, it has now shown a dream run above 300 and is one of the only banks that hasn’t been consistently weak.

Volatility:

This week showed us the highest close for India VIX since roughly COVID levels. But it isn’t a big cause of worry as we have seen intraweek/intramonth spikes upto 30.

Since VIX is rising, it may be wise to keep a close watch on any short vega positions you may have (or short options in general).

For your reference, a lower VIX (or lower volatility) is generally associated with price moves that are less choppier and more trending. It also results in lower option prices (due to a lower IV). But at the same time, the ATR (Average True Range) of the stock would be narrower.

Disclaimer:

We, Anosh Mody & Krunal Rindani shall take no responsibility for any losses occurring out of investment/trading decisions you make based on the contents of this article.

We are not SEBI registered investment advisors. This article is meant for educational purposes only, please consult your investment advisor before acting upon any information you see here.

We may or may not have open positions, kindly assume that we are biased.

Anosh Mody is an MBA student from SBM, NMIMS Mumbai. However, the views reflected in this article are strictly his own, and in no way reflect upon the B-School in any manner.

Follow Us @

Subscribe To Our Mailing List!

* indicates required

Leave a Comment

Your email address will not be published. Required fields are marked *