
We’ve come a long way...
Within the investment management and trading arena, a wildly mistaken niche is thriving, though in relative anonymity. This niche is known by many names like quantitative or quant trading, black box trading, systematic trading, or automated trading. It is one of the fastest paradigm shifts we have seen, in our involvement with the financial markets over the past 40 years. This calls for a bold statement- We are no longer limited by a human bandwidth.
Algorithmic trading is a method of stock trading that uses intricate mathematical models and formulas to initiate high-speed, automated financial transactions.
According to Moore’s Law computer power increased almost remarkably (speed doubles every eighteen months, and still does today, over a third of a century after he first promulgated the courageous forecast) and computers became main- stream tools, the power of computerized algorithmic trading became inevitable.
This might sound strange and absurd, but the real distinction between a quant trader and a permissive one is precisely a technological one. From a very young age, we are taught that machines and technology have made our lives simpler, easier and convenient. They have overtaken our monotonous and continual tasks, many times proven to be better than us. They are proven to be more disciplined and have zero emotional quotient- whether it’s producing cars or a check-out cashier in a supermarket. Investing and trading can also be systematized. Rather, it should be systematized. The math wizards of our generations have gone long course to make it possible and have been rewarded enormously. Car building is car building, whether it’s a human turning the sprocket or a machine doing it. Likewise, a check-out cashier does the same job of transacting as would a human being. The work performed is the same, just the means to do it is different. This is a technological difference, at its core.
Some Data to get your attention
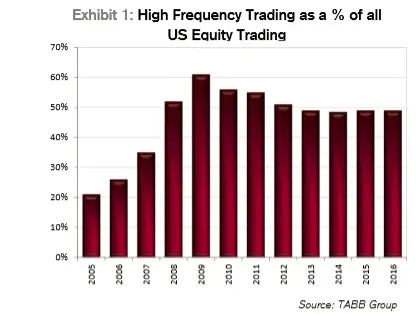
“Eighty percent of daily volume in the U.S. is done by machines, so what you get is a lack of focus on earnings, a lack of focus on outlooks and you just get short-term movements based on very specific data that is released every day and that creates noise,” Guy De Blonay, fund manager at Jupiter Asset Management, told CNBC’s “Squawk Box Europe.”
The daily volume of algo trading can change according to volatility, but lately over the last few years its influence has become more visible. In 2017, J.P. Morgan said that “fundamental discretionary traders” accounted for only 10 percent of trading volume in stocks. The type of traders that look at companies’ performance and outlook before deciding to buy or sell shares.
What are Quants?
Quants design and implement an alpha-seeking strategy based on exhaustive research that allow financial firms to price and trade securities.
Alpha, the expounded version of the Greek letter ‘α’, is the portion or excerpt of the investor’s return excess to the market benchmark (for example- the S&P 500), or, in other words, the value added or lost exclusively because of the quant or the manager.
Unlike alpha, which measures relative return, beta (β ) is the measure of relative volatility. It measures the systematic risk of a security or a portfolio in comparison to the market as a whole.
For example- If during the year, S&P5OO gained 10%, whereas the alpha-seeking model gained 15%. The alpha here is 5% (assuming beta is exactly 1).
One thing that demarcates quants from non-quant investors is that quants are forced to deeply research, study and back-test their strategies. To make a computer understand the strategy takes a great deal of effort and patience from the developer. The algorithm needs precise and absolute details or else it’s close to nothing. A computer cannot be ordered – “Find overvalued stocks.” You have to treat it like a small baby, feed it information and explain each and every step along the way. Like what does ‘find’, ‘overvalued’ and ‘stocks’ mean to you?
There is nothing absolute in this industry, we are exposed to enormous amounts of subjectivity. It’s all a matter of judgment while setting the guidelines for the alpha model.
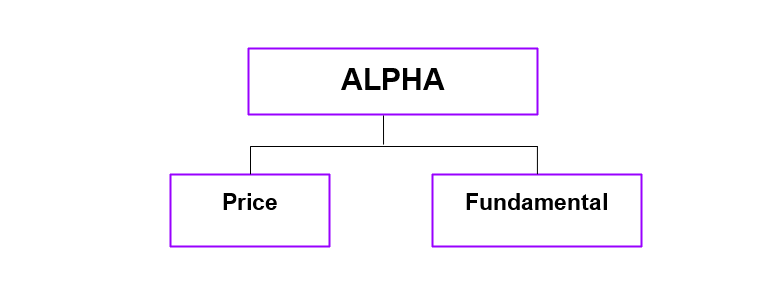
Strategies involving Price-related data
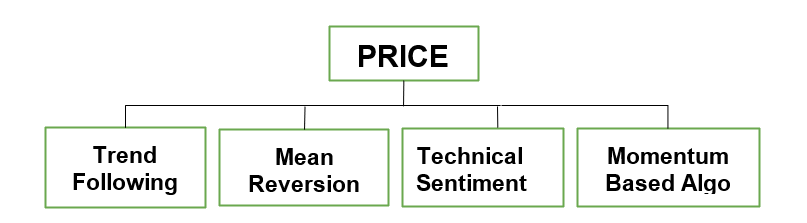
First, we will look at alpha-models involving price related data like price of the instrument, volume or open interest. These data directly come from the exchanges to your computer.
Trend Following System
As an investment and trading style, trend following has existed for a very long time. Some 200 years ago, the classical economist David Ricardo’s famous imperative to “cut short your losses” and “let your profits run on” suggests an attention to trends.
Trend following is based on the theory that markets sometimes move for long enough in a direction that one can identify and join in. The economic rationale for the existence of trends is based on the idea of consensus building among market participants.
It is important to note that trends are binary, meaning either an asset is trending or not. The resulting strategies typically also share similar binary tendency, switching from risk-on to risk-off allocations.
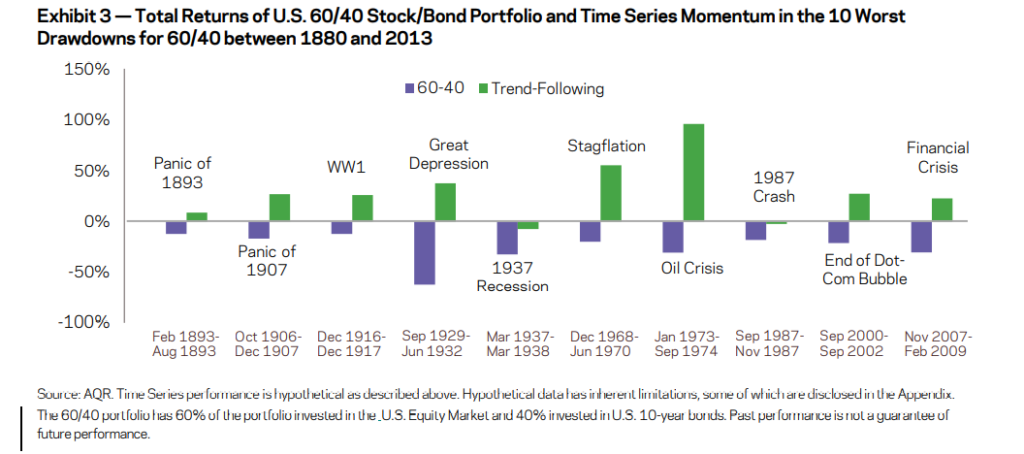
Trend following systems have existed and been profitable for as much as 150 years. A report by AQR Capital Management shows that the trend-following system realized a net return of 11.2% (after 20% performance fees and 2% management fees) from January 1880 to December 2013. They compared their results with an average old-school 60-40 stocks to bond portfolio and the results were phenomenal. Trend-following investing makes an extremely bold and strong return, surpassing the worst recessions the humans have ever faced. Putting up positive returns 8 times out of 10.
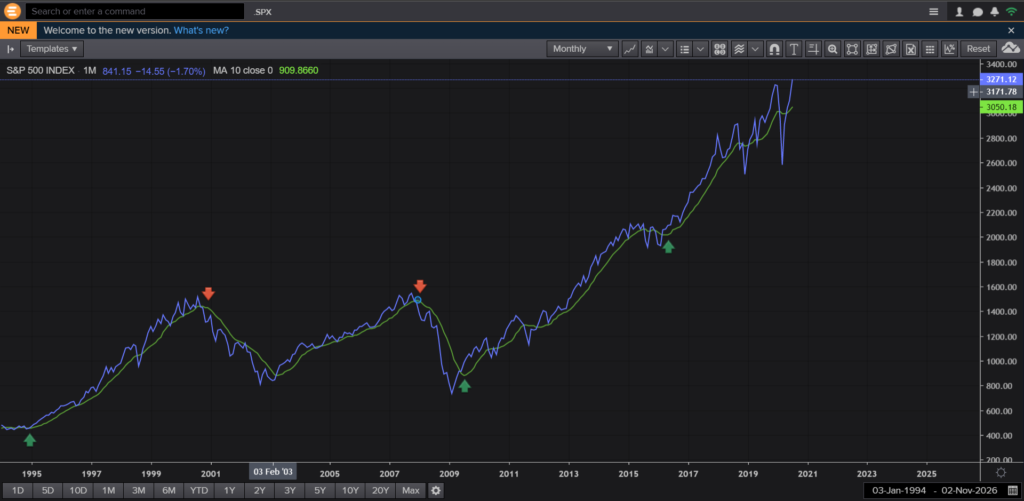
A straight forward example – In the above chart, you go long on the S&P 500 when the 10month Simple Moving Average crosses the index and short when the MA crosses the index from above setting a trailing stop-loss.
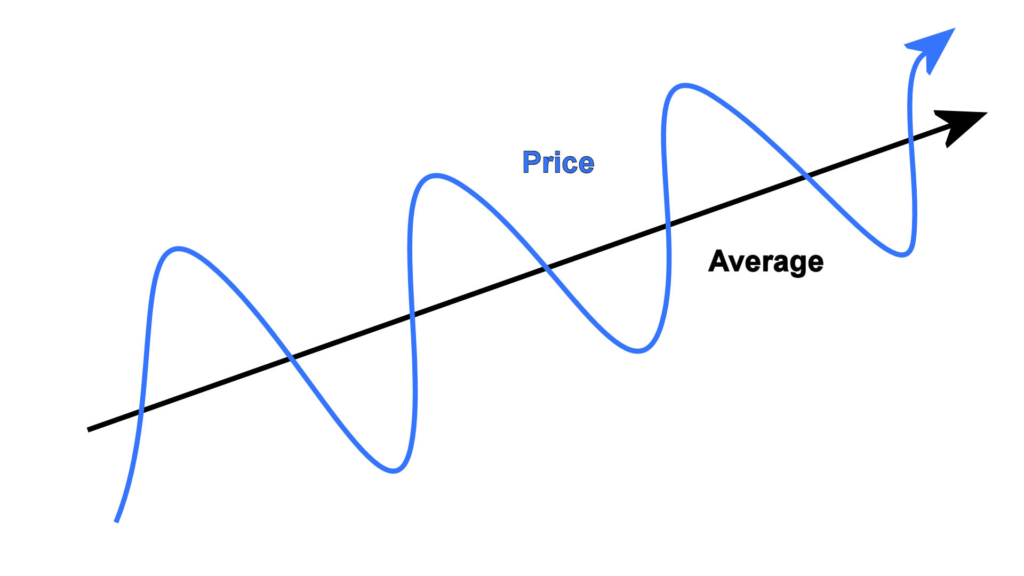
Mean Reversion
Mean reversion strategies bet on prices moving in the opposite direction to that of the prevailing trend. The logic behind mean reversion is that there exists a center of gravity or an equilibrium, in simpler words average, around which the prices tend to fluctuate. These might be due to sentimental or short-term disturbances among the participants. The algorithm must identify the divergence between the mean and the current market price and what fluctuation is enough to affirm a trade.
Just as in trend following, there are compelling rationales behind presence of mean reversion-
i. There are often short-term inequalities between the buyers and sellers, due to liquidity and information asymmetries, which might lead to an instrument getting into overbought or oversold territory.
ii. Another rationale is that markets are hugely swayed by human behavior. One of the key observations of behavioral finance is that humans often over-react to news and events. As such, stocks usually tend to move more than their justified nature. The market then corrects this over-reaction at a later point of time, coming back to its rightful equilibrium.
Prices might deviate from that long term mean due to sentimental or short-term disturbances on the market but eventually will revert back to its intrinsic value.
FACT: When discretionary traders implement mean-reverting strategies they are known as Contrarians.
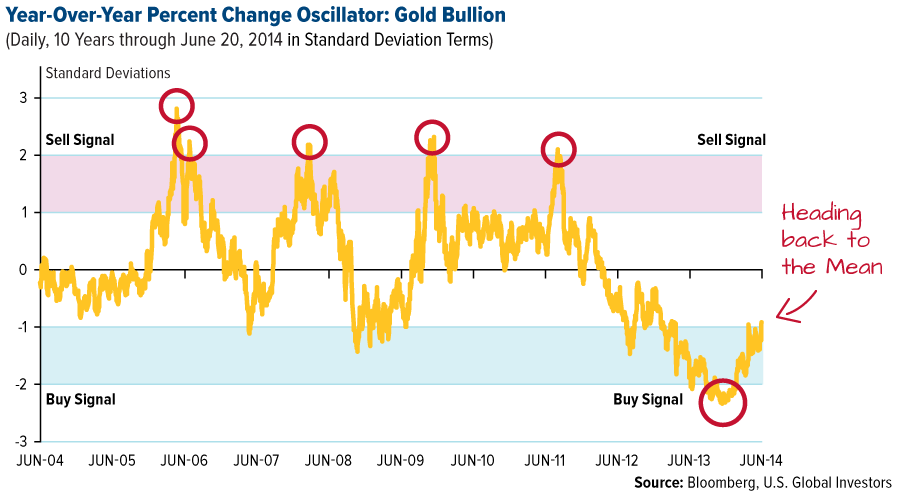
Technical Sentiment
We can examine investor sentiment through price, volume, and volatility behaviors as an indicator of future returns. There is a very thin line between what should be and what should not be used as sentiment information in forecasting, because it has massive subjectivity tagged along with it. Just as some people look at cheap prices for buying the dip and some feel like this might fall further.
Some examples of technical sentiment strategies are-
i. To look at the VIX (Volatility Index) as a measure of a volatility in the market. VIX is a promising indicator that displays signs of nervousness and fear in the market.
ii. Looking at the volume of the put/call ratio, which one of them is higher than the average, might give us a glimpse into the future.
iii. Another example of option-based sentiment in equities utilizes the implied volatilities of puts versus calls. Naturally, because stocks move down quickly but take time to tread higher, indicating downside volatility is higher than the upside volatility. Hence, the seller of a put option demands a higher price (therefore ‘implied volatility’) than the seller of a call option.
Momentum Based Algo
The binary nature of trend eliminates the asset’s rate of change, because trend following systems only focus on direction and not the magnitude. Ignoring the rate of change or momentum is equal to solving a jigsaw puzzle without all the pieces. By considering the rate of change into account, we progress from trend to momentum. And unlike trend, momentum is a number, which we can compare and sort by.
The rationale behind momentum is that a past rate of change is indicative of future returns. In other words, we expect assets with higher momentum to perform better than those with lower momentum.
Momentum-based algorithms are usually short-term trade setups that follow when there is a spike in volatility or a volume ignition. Strategies could include trading earnings and major events, breakouts and breakdowns, and gaps. These could be highly risky at times because of high volatility and volumes. Hence, strict stop levels and pre-determined risk exposure is prudent and advisable.
For example- An algorithm that trades major company events and earnings calls in U.S. Equities would have a profitable Q2 2020, because of 76% earnings beat compared to misses. (Assuming strict money-management and pre-defined risk measures are followed.)
Strategies involving fundamental data
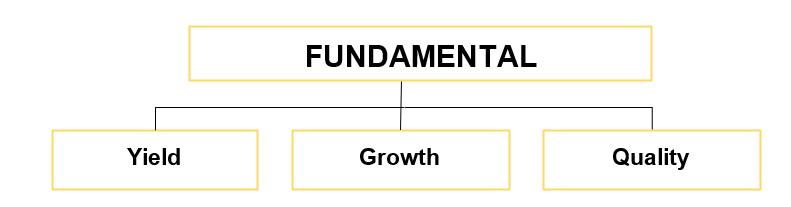
For a long time, fundamentals have been part of the discretionary trader’s toolkit, fundamental quantitative strategies are relatively budding. The alpha models based on fundamental data can be easily categorized into-
- Value/Yield
When you hear value investing, Warren Buffet always comes to our mind. A legendary investor, who’s barely used a touch-screen phone in his life. Connecting this very value investing to complex quant systems is a bit strange right?
Value strategies are usually associated with fundamental factors versus price of the instrument such as Earnings yield (E/P), Dividend yield and so on. The elemental thought behind value strategies is that higher the yield, cheaper the instrument.
In reality, the logic behind value investing is that the markets exaggerate the risk in the risky assets and underestimate the risk in less risky ones. Hence the terms ‘under-valued’ and ‘over-valued’ are tossed around valued investing. So in some sense, the value investors are being paid to take on the risk of standing in the way of momentum.
- Growth strategies
Growth models make predictions based on an instrument’s historically observed or expected level of economic growth. A given growth asset implies nothing about its valuation or yield, it just shows us that it has better prospects of rapid economic growth.
Some growth metrics are- Price/Earnings-to-growth (PEG) ratio or (PE ratio vs EPS growth rate), are a basically forward-looking concept of value.
- Quality
A quality investor literally would like to own a high-quality instrument and sell or short poor quality instruments. Quality is very instinctive and subjective in nature and can take various forms.
Quality signals could range from owning less-leveraged companies compared to high-levered ones, using a specific debt-to-equity ratio as a benchmark for your model. Other kinds of quality signals could be the number of revenue sources, management personnel, investor sentiments or fraud risk.
For example- The Greek financial crisis was a series of debt crises that started with the global financial crisis of 2008. There were two primary reasons behind the crisis. Firstly, Greece was crippled by government economic mismanagement and transgression (management personnel), including widespread fraud (Fraud Risk) and an absence of public accountability. Secondly, Greece’s participation in the Eurozone was inconsistent and contrary to adjusting their fiscal, monetary and political policies to meet their financial needs and goals.
This situation asks us to sell or short the Greek Economy based Traded Funds.
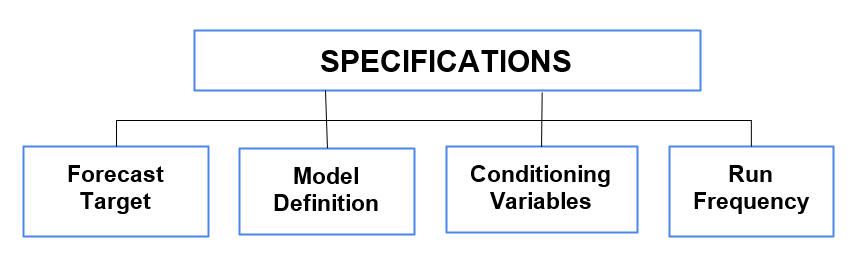
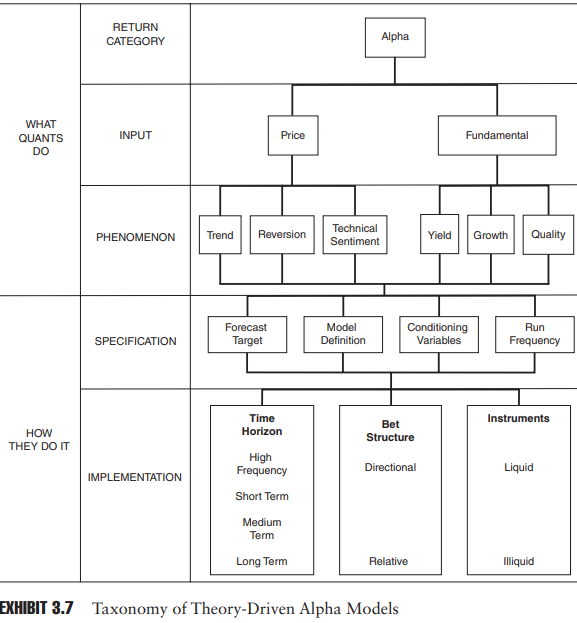
- Forecast Target
One of the preliminary steps with implementation of the alpha-model is deciding ‘what’ the model actually tries to forecast or predict. Models can forecast the direction, magnitude (how much), or even the duration of the move. Furthermore, a forecast model can even predict the strength or probability of their forecasts!
- Model Definition
The quant must precisely define every aspect of the strategy before it’s usable. The way things are defined would entirely change one trend following system to another.
A crucial part of the quant’s job is deciding the strategy mathematically and quantitatively. This area is given significance because this turns out to be the key differentiation between multiple quant models. This gives the model comparative advantage and benefits.
- Conditioning Variables
Condition as the name says, adds an extra layer of instruction or security to the model. This might come with some complexity and rigidity, but they increase the efficacy and longevity of the forecast model. No model can attain 100% success rate in the markets, markets are much bigger than the quant’s model, of-course. Hence, there should be a condition that knows to take a loss and not dig deeper into the pit.
There are two types of condition variables-
i. Modifying Condition- This modifies the trading signal and alters how the signal is implemented. Stop-loss, trailing stops and take-profit targets are part of modifying conditions.
ii. Secondary Condition- This tends to seek agreement among various conditions, to implement the trade. For example, your strategy is to find stocks with P/E of 5, growth opportunities and undervalued price. The model will find stocks that meet all the conditions mentioned.
- Run Frequency
Run frequency is the component that focuses on the idea generation of the alpha-model. The frequency with which the model generates new investment and trade ideas. There has to be an optimum balance on how frequently should one run it. Too frequently might bring too much noise that it does not want. If there is too much gap between the model might miss on significant and strong moves.
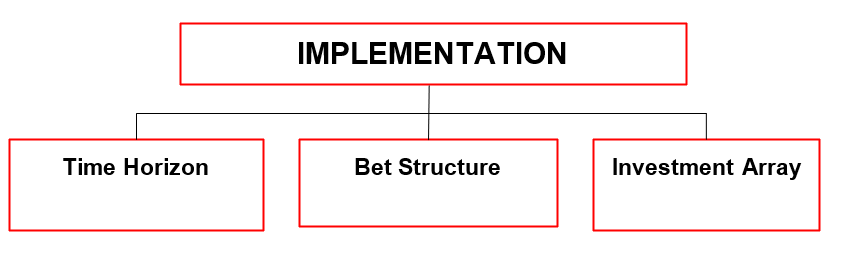
- Time Horizon
The time frame under which an alpha-model forecast, literally ranges from a few microseconds to a couple of months to few years. This leaves a quant having to make a choice of time horizon from a range of infinite possibilities.
There is huge variability of returns from an hourly strategy to a monthly strategy. In a very miniscule time-frame, a small difference in the strategy can amplify among thousands of trades in a day or million trades per year!
The lines of differentiation between these timeframes are extremely arbitrary, hence one needs to have a clear picture and balanced judgement with this model.
- Bet Structure
Bet structure is based on ‘how’ the model generates its forecast. Models can either work on absolute basis or relative basis.
For example, a model can predict that Silver is expensive and might fall or that the silver is relatively more expensive to gold, and that gold is therefore likely to outperform silver.
In particular, relative forecasts could help you anticipate the behaviour or smaller chunks relative to the sectors or indices. Smaller chunks are easier to interpret and analyse whereas the latter gives you the larger picture.
Pairs trading is one of the favored bet structures because their comparison is quite effortless and direct. For example, pairs trading of American Airlines ($AAL) and United Continental Airlines ($UAL) which have a correlation of 0.95. Their high correlation could help us to trade small and minor discrepancies between them.
- Investment Array
The quant must define what instruments to include or exclude, the instrument can be segregated in terms of their geography, asset-class, instrument class and the liquidity it offers.
- Diversity of Strategies
A last, significant ramification of these details of implementation is that they lead to an explosion in the variety of quant trading strategies that really exist. You can easily see that the number of permutations of a strategy focused on the concept of value, for instance, is enormous when accounting for differences in the type, time horizon, bet structure, investable universe, model definition, conditioning variables, and frequency of model run. Just taking the initial four kinds of implementation details mentioned here, there are two types of forecasts (direction and magnitude), four types of time horizon (high frequency, short term, medium term, and long term), two types of bet structures (intrinsic and relative), and four asset classes (stocks, bonds, currencies, and commodities). Therefore, one could build 64 different value models (2 × 4 × 2 × 4 = 64 permutations) and this excludes the question of how many ways one can define, for instance, trends.
For Sources, Click Here
Follow Us @
Some Unrelated Stories!

Sources
Hi Harsheel,
Excellent writeup,
Can you please also throw some light on how one should start in this algorithmic trading world. I mean is there any course / platform recommended to simplify the complexity involved.
Hey Ashah,
Thanks for reading!
1. To start with algorithmic trading, I would recommend reading books written by Quantitative Trading by Ernest Chan, Inside the Black Box by Rishi K Narang. These are light-reading books and should help you with basic concepts.
2. Next thing you could do is start with online courses. Online courses by Quantinsti or Quantra, Quantifycapital, Coursera and Udemy.
3. There are quite a few platforms like QuantConnect, Quantra Blueshift and some more to back-test your strategies and have some basic overview.
Regards,
Harsheel Dani