The Invisible Hand?
We are all guided by an invisible hand that is deeply embedded in our minds and systems; it is so intuitive that we do not even realize most of the time. This same invisible hand that regulates our day-to-day decisions on how much to buy from the supermarket to the decision-making at a macro-level for deciding the interest rates of an economy. We know this invisible hand as Demand and Supply, one of the most fundamental concepts of economics.
In financial markets, there are millions of investors, scratching their heads, that come together electronically to agree on a price. They all have their own perspectives and psychologies that determine their trades, which affect the price. Studying these price patterns and trends over time, studying these millions of investors and their decisions on just a chart, is called technical analysis, at its heart.
Some of the smartest people in the past few hundred years have tried to master and time the market and have failed miserably. It’s not a surprise that the world’s renowned analysts and even Nobel Prize laureates like Albert Einstein have tried and failed at market speculation. Granted, there have been many success stories along the way, but they are the exception, not the rule.
To have a good understanding of the principles behind technical analysis, I think it’s important to be clear about the philosophy and psychology behind the demand and supply dynamics that make technical analysis possible.
Markets Discount Everything…
The market is a forward-looking and discounting mechanism. All the political, psychological, entrepreneurial, fundamental, and otherwise are reflected in the market’s price, the market has discounted all the current and future forthcoming events.
A technician is never seen switching news channels or reading financial statements and press releases all day long. All he/she does is read price charts and come up with a conclusion. Technicians do not care about the reasons behind why things happen, that’s not their work. They believe that the price of the asset class has already discounted the reasons.
Isn't The Past Always A Prologue?
Critics of charting claim that past price data can’t be used to predict the future, or that Chartism is a “self-fulfilling prophecy.” Let’s consider if the first claim makes any sense: What form of forecasting does not use past data? Don’t all economic and financial forecasting involve the study of the past? Think about it. There is no such thing as future data, all we have is past data. Today, we have potentially realized that data is the most valuable asset humans have.
If you worry about the self-fulfilling prophecy, turn on CNBC and listen to the conflicting opinions of market analysts. As with any method of forecasting, market analysts often differ on how they interpret the same data. Everyone has a unique approach and price target for a stock, if Goldman Sachs sets a price target of 3600 for S&P 500, Credit Suisse might have a 2600 price target. There is constant bickering and chaos, largely trying to confuse the retail investors.
Much of the study of technical analysis is related to the study of human psychology. Chart patterns that have been identified and characterized for the last couple hundred of years. We still find these on price charts today. One must believe that the future is just a repetition of the past, to excel at Technical Analysis.
Bird’s View
One of the great strengths of technical analysis is its adaptability to virtually any trading medium and time-frame.
A technician can easily follow as many asset-classes as he/she desires which is generally not true with a fundamental investor. A technician can trade equities, commodities, forex, or fixed-income securities at the same time. As a result, a technician can rotate his or her attention and capital to take advantage of the rotational nature of the markets. At different times certain markets become hot and experience important relative strength and potential than other asset-classes. During these moments, a technician can easily move his capital to these booming markets, to realize higher gains.
Another advantage the technician has is the big picture, by following all the major markets. He/she gets an excellent feel for what markets are doing in general now and avoids the distorted and tunnel vision.
Using Multiple Timeframes
Another strength of technical analysis is the ability to manage multiple time dimensions. Whether the trader is using intraday tic-by-tic changes for day trading purposes or long-term investing. Technical analysis gives you enough space to analyze multiple timeframes at the same time.
Markets Trend
Market’s trend is an essential premise that a technician has to believe, if one believes otherwise technical analysis will never make sense. There is a corollary to the premise that prices move in trends- a trend in motion is likely to continue than to reverse. This corollary is an adaptation of Newton’s first law of motion.
Some believe in random work theory, and that prices are serially independent. In a nutshell, prices are unpredictable and random. How do these random walkers explain the existence of ‘Trend-following firms’ that have an immense track-records in the markets over the past hundred years? Coining the terms ‘bull’ and ‘bear’ markets would be useless because it would be an antithesis to the random walk theory.
What Is A Trend?
Have you ever come across an asset-class that just goes up in price, makes all-time-highs every day? Dumb enough to even think of it that way, right?
Trend is simply the direction of the market. It could be up, down, or flat. Market moves are characterized by a series of peaks and troughs, which mainly determine the trend of the price.
This is a price chart of Advanced Micro Devices Inc., displaying all three phases of a trend.
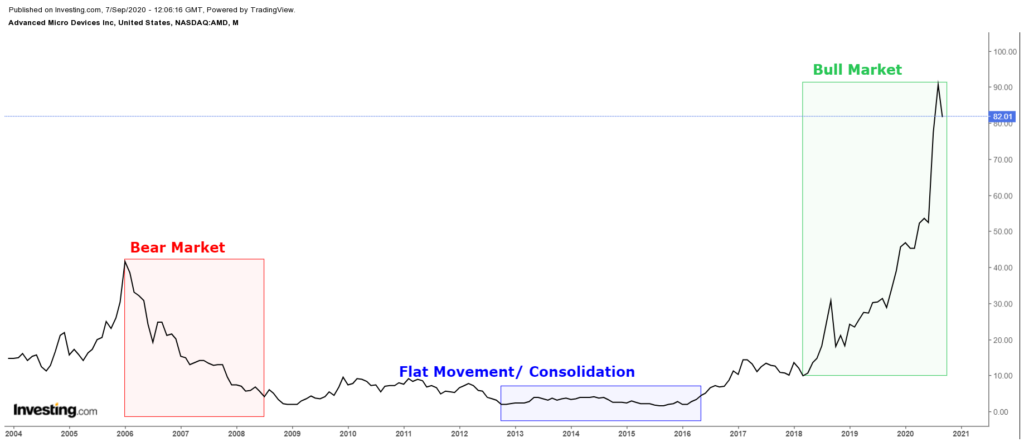
Bear Markets: Bear markets comprise descending peaks and troughs or are also called a downtrend. During bear markets, there is more selling pressure and the bears take control, which drives the prices lower.
Bull Markets: Bull markets comprise ascending peaks and troughs, or also in an uptrend. There is more buying pressure and bulls take control, which drives the prices higher.
Bull markets last longer because bulls climb up the stairs, whereas bears jump out of the window. This means that bull markets last longer, whereas bear markets are usually short-phased.
Sideways/ Flat Movement/ Consolidation: This phase is also called as trendless. These phases often come before or after a significant move has happened or is impending. These could be boring and annoying, but rewarding for the patient traders and investors.
Support And Resistance Levels
The concepts of support and resistance are undoubtedly two of the most highly discussed attributes of technical analysis. Part of analyzing chart patterns, traders use these terms to refer to price levels on charts that act as barriers.
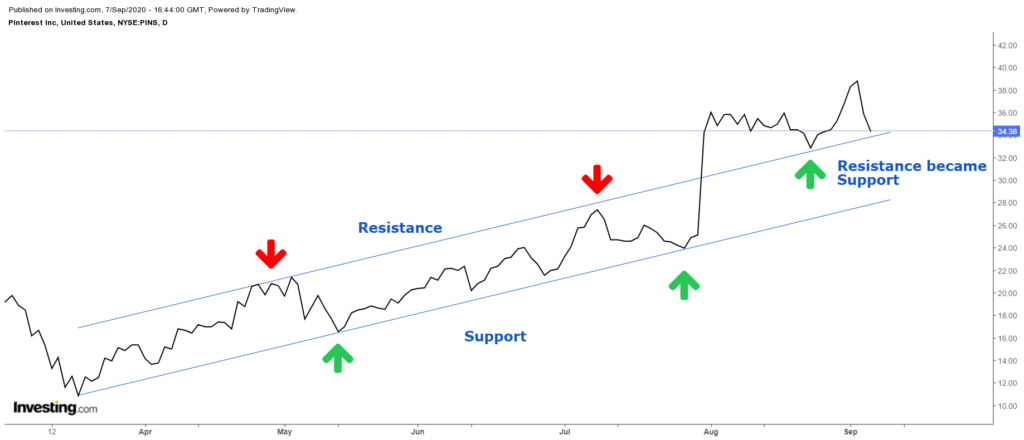
Support is basically a floor, analogically the price stamps its feet on a support and goes higher. Support is where buying pressure exceeds the selling pressure, hence driving the price higher.
Resistances are the opposite of support. Resistances or ceilings are price levels where selling pressure exceeds buying pressure and hence drive the price lower.

In an uptrend, the price easily exceeds the resistance levels at some point. In a downtrend, the support levels are not strong enough to stop the decline permanently but do act as pauses.
Polarity Principle
The added value of recognizing where supports and resistances are that they are constantly flipping sides. You will often see former resistances turning into support, and former support turns into resistance.
Trendlines
Technical analysis is an art (skill would be more apt) and not a science. There is not a perfect way of doing things, it’s subjective and judgemental. It’s just like asking two artists to draw with a motive to make money by selling their artworks.
Trendlines are simple straight lines that connect ascending.
A trendline is possibly the most invaluable and simplistic tool in the study of market trends and technical analysis. Chart analysts use trendlines to determine the slope of a market trend and to help determine when that trend is changing. The most common use of trendlines is to determine uptrends and downtrends. An up trendline is drawn under the higher lows or higher troughs. A down trendline is drawn above the declining market peaks or lower lows.
Japanese Candlesticks
Japanese candlesticks were introduced to the western world by Steve Nison in his book Japanese Candlestick Charting Techniques. Many traders find candlesticks more visually alluring than bar charts and believe that candlesticks include more relevant price information.
The history of technical analysis and Japanese candlesticks runs back to the 1800s, where it was popular among the Japanese rice futures traders.
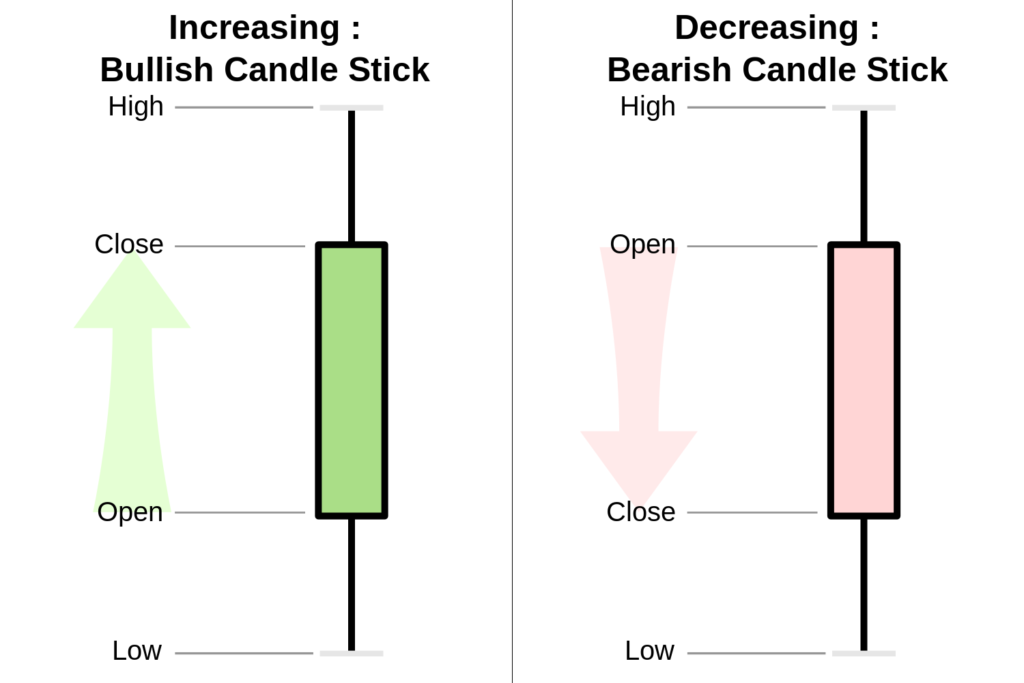
The colored part is called the ‘body’ and the extended lines are called the ‘shadows’.
DOJI
Not all candlesticks need to have well-defined real bodies, when they do not they are called Doji. They open and close at the same price, displaying indecisiveness among buyers and sellers.

Other than doji, there are many candlesticks patterns. They explain the psychology and result for that time period, who dominated bulls or bears or none.
Technical Indicators
Traders use various technical indicators to aid and confirm their analysis. To not burden you much, I have only mentioned two indicators-
Moving Averages
We have long associated immense value to central tendencies or averages. Moving averages are a smoothing function. They act like an average of closing prices over a period, continuously. By averaging the data, it produces a smoother line, making it much more convenient to view the overall trend.
For example, a 200-day moving average of closing prices is desired, the closing prices of 200 days are added and divided by 200. The term moving is used because only the latest 200 days’ prices are utilized. Hence, this line moves further with every new trading day.
There are many types of moving averages like simple, weighted, and exponential, and an infinite combination of different moving average periods that could be used together.
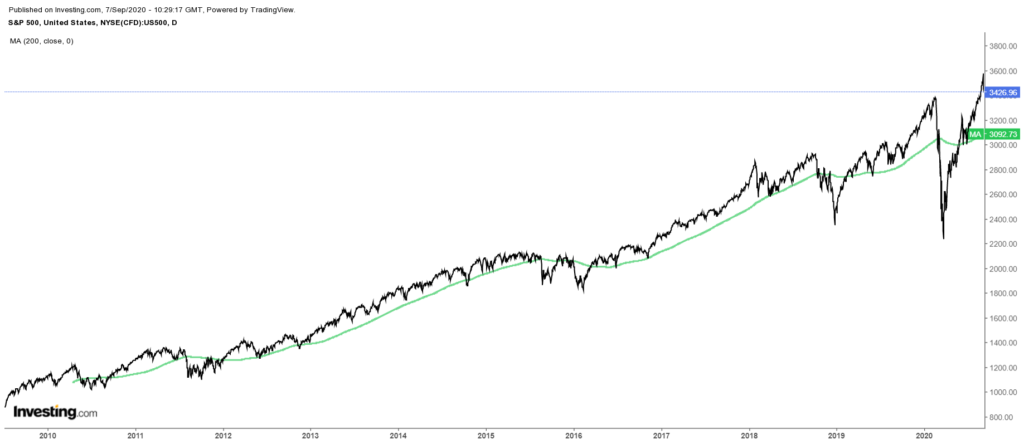
This is an example of a 200-day moving average on a daily chart of the S&P 500.
Relative Strength Index
The relative strength index is an oscillator. An oscillator tells us the momentum or pace or rate of change at which the market is rising or falling.
The key value of this oscillator is that it presents the analyst with upper and lower bound, which tells them overbought and oversold conditions. The values of the RSI oscillator range from 0 to 100. We consider readings over 70 to be overbought and below 30 are considered oversold. Applying those two boundaries to any market condition eases the search for markets that have reached extreme levels.
RSI = 100 – 100 / ( 1 + RS )
RS = Average of ‘x’ days’ up closes/ Average of ‘x’ days’ down closes
x = Usually 9 or 14 period
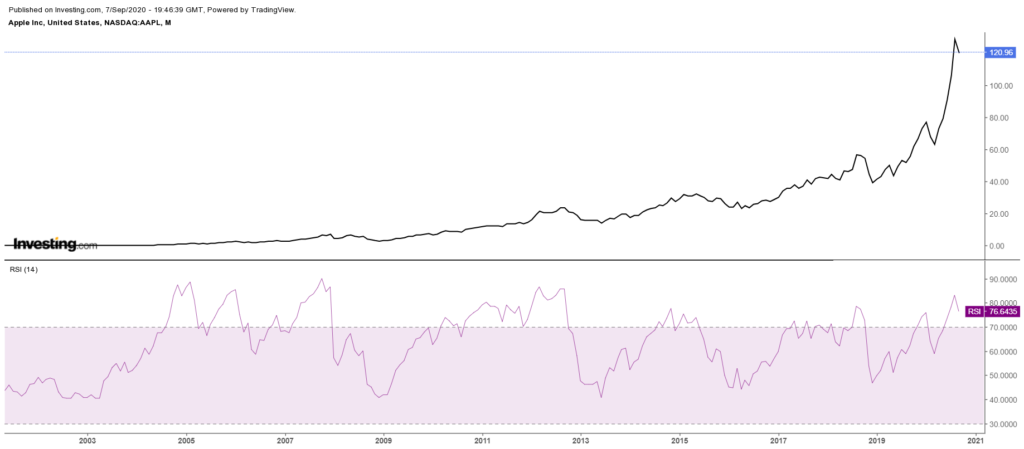
Fibonacci Retracements And Extensions
Among millions of technicians, there lies a unique group of them, who pursue Fibonacci retracements and extensions for deriving price levels. They are based on the key numbers having special mathematical uses, originally identified by mathematician Leonardo Fibonacci in the 13th century.
As absurd as a pair of weird ratios like 0.618 that help you determine price levels might sound, they work. Let the chart speak for itself.
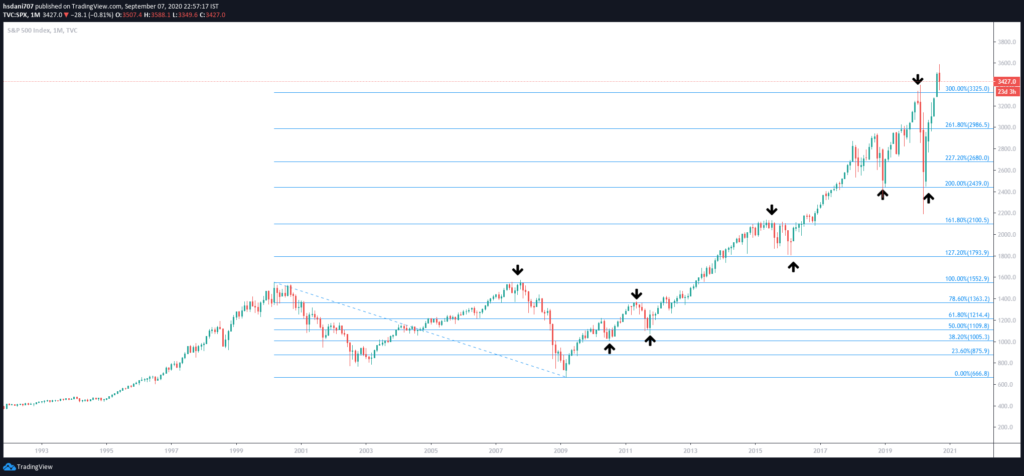
A Typical Day In A Technician’s Life…
A technical trader need not be in front of a screen all the time, for a fact they can prepare their trade set-ups when the markets are closed. All they have to do is go through a bunch of charts, set alerts, and place orders. He/she works on the sidelines more than during market hours, aiding them to make it a part-time gig.
He/she is not under the media’s spell and believes the charts over everything. He/she rarely cares about the company’s fundamentals and income statements etc, literally. A brief description of the company’s business model satisfies him/her.
Obviously, the time and the technique one wants to devote and pursue depends upon the individual’s discretion. He could either trade intra-day or invest for a few months or years, hence varying their screen-time and research time.
Follow Us @
Some Unrelated Stories!

