Market Chronicles for the week ended 31st July, 2020.
Our bullish call from last week didn’t play out as thought, with Nifty ending the week 1% in the red. This move has snapped a 6 week winning streak for the index
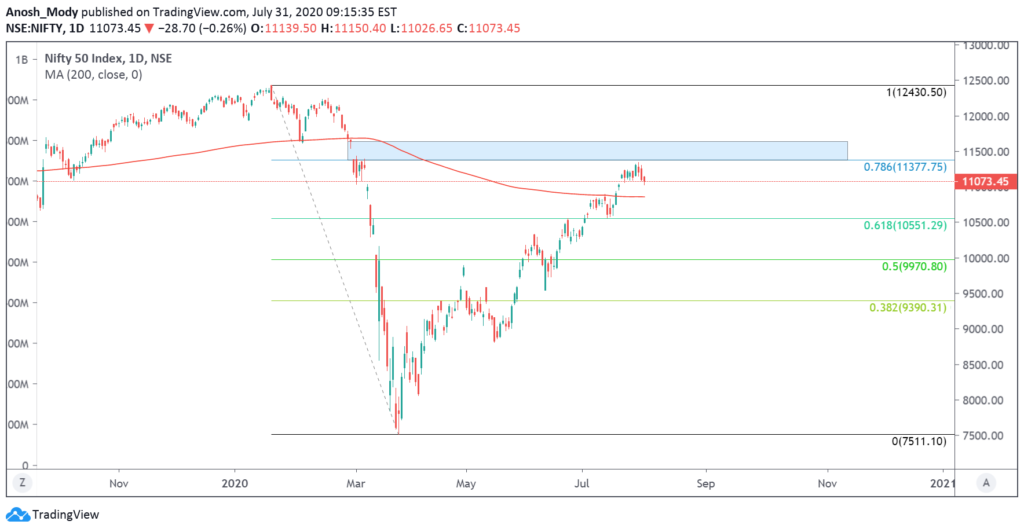
Our outlook is CAUTIOUSLY BULLISH, as a retest of 200 DMA (10860) cannot be ruled out. Also, (11377) can act as firm resistance to the upside as a confluence of 78.6% fibonacci level and the floor of an open gap.
Please read on to understand our rationale. This article contains an analysis of technical parameters as well as open interest and derivatives data. All the information below has hints for what levels to watch out for in weekly trade. Replicating these on your charting software and keeping an eye on them can help minimize unpleasant shocks in your trading.
A few charts illustrate all that happened:
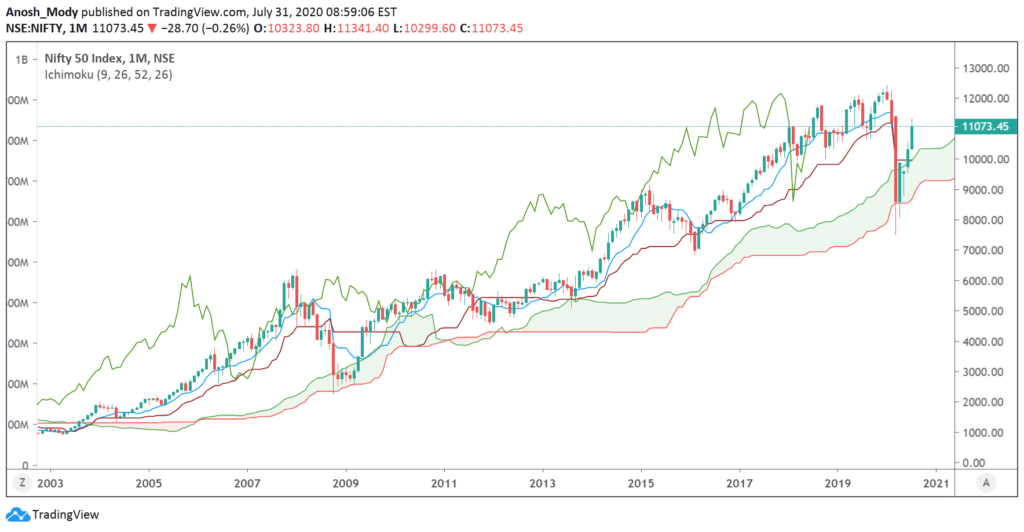
1) Healthy gains of 7.5% in the month of July
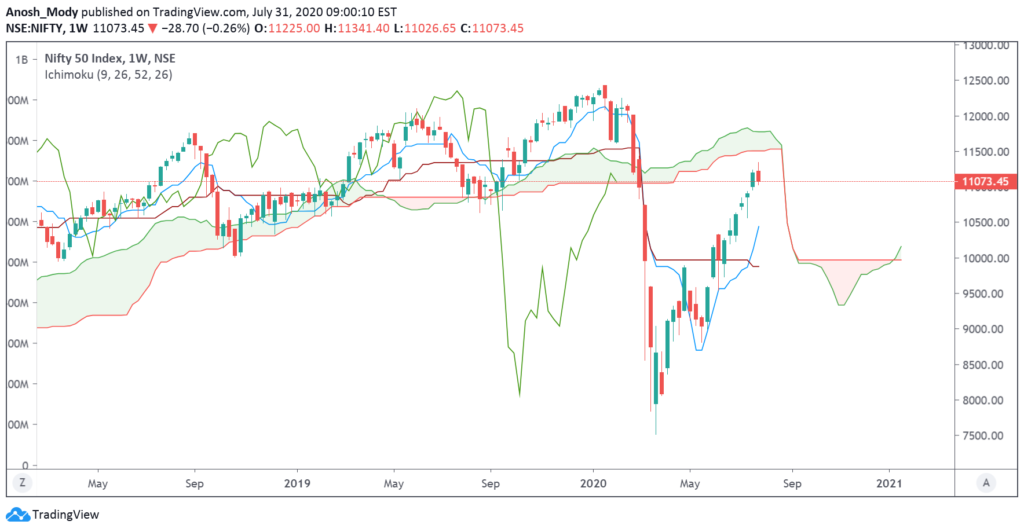
2) Expect resistance near 11500 as the weekly ichimoku cloud can hinder upside
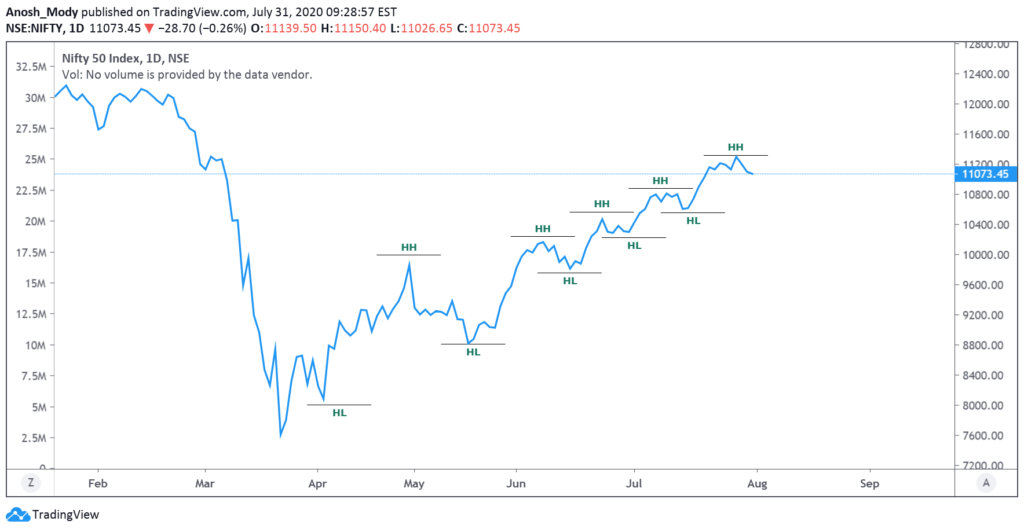
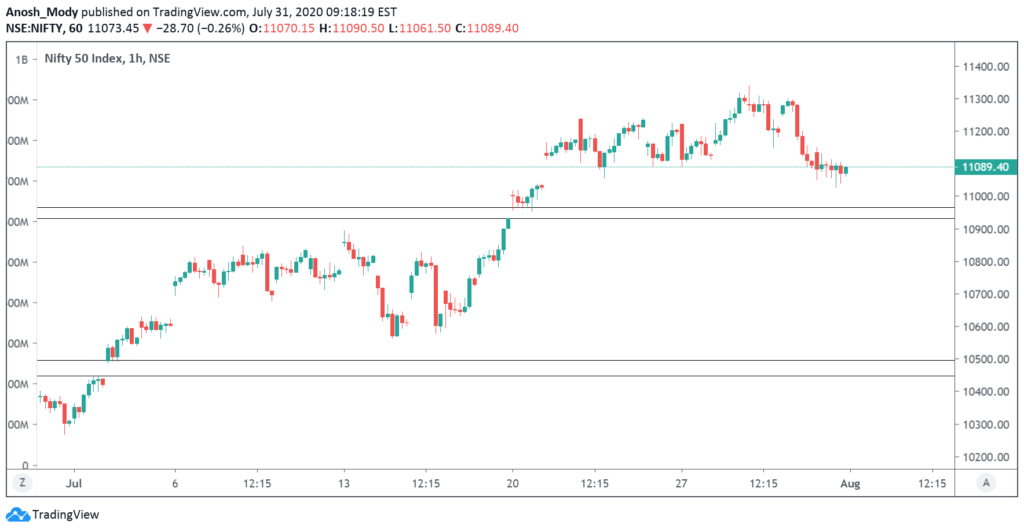
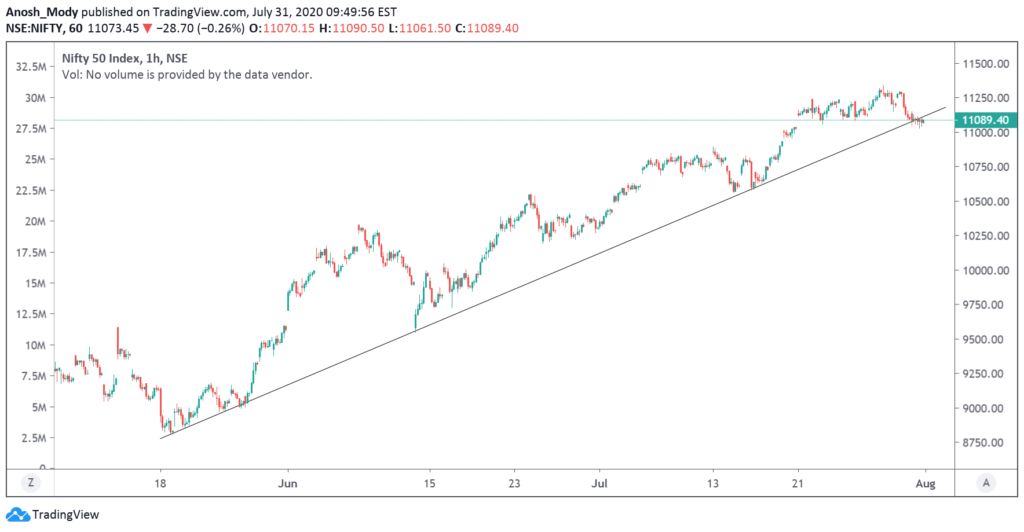
3) The uptrend is firmly intact, with the latest Higher High at 11318, and the latest Higher Low at 10600. (Basics of Dow Theory)
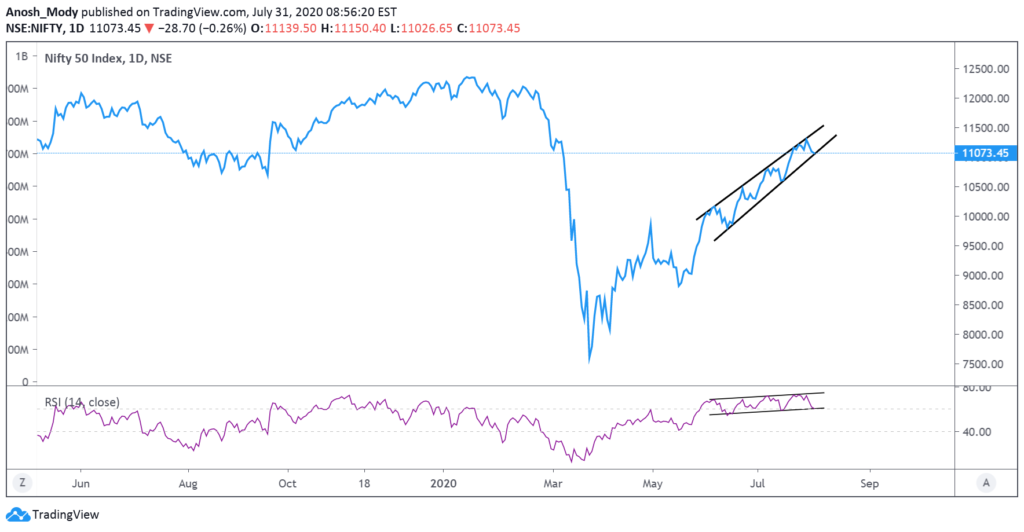
4) An interesting pattern forming on Price and RSI on the daily chart, will be interesting to see how this move.
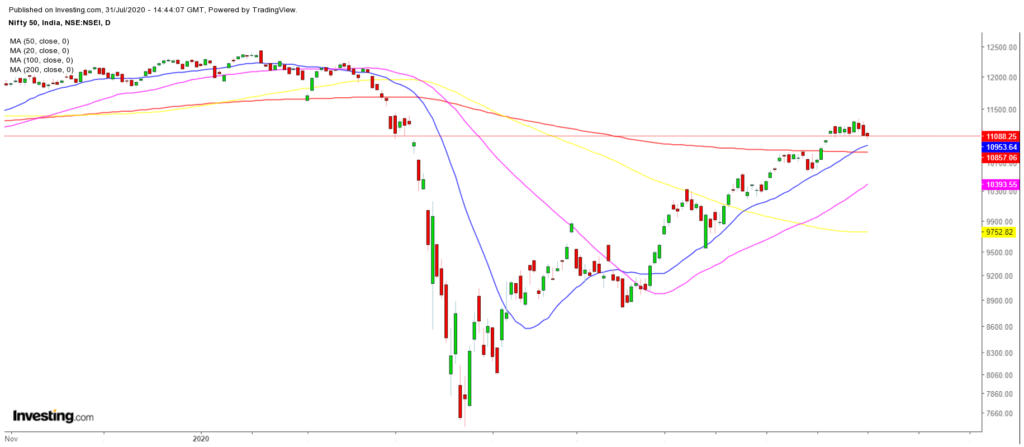
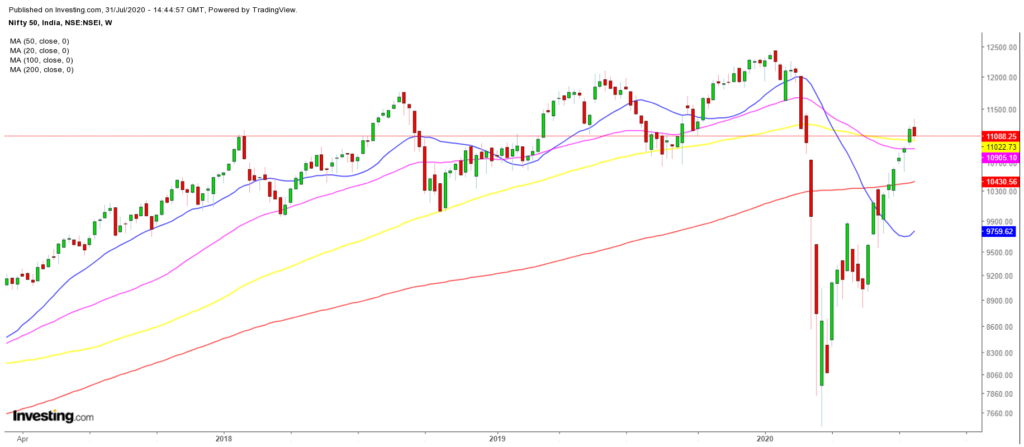
Moving Averages
A quick snapshot of how the major Moving Averages are placed on the daily, weekly and monthly charts
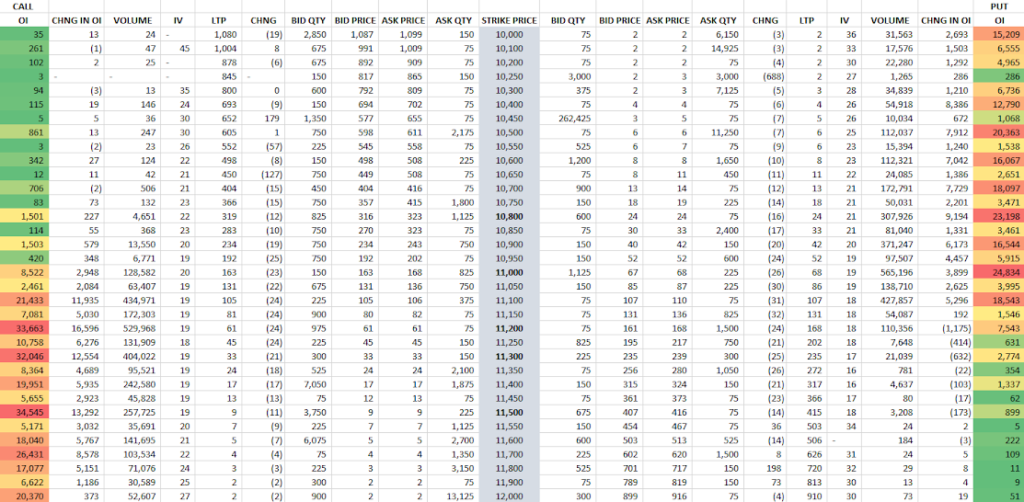
Open interest or OI is the total number of open positions in the market. A high OI indicates that there is a lot of activity in that instrument. It does not indicate buyers and sellers individually but is instead a more holistic measure, i.e. it is the number of contracts between the buyers and sellers, not the buyers and sellers on their own. One of the ways OI analysis works is that high-volume market participants would have sold strangles at strikes which leads to higher OI. This type of reading does not typically account for other types of spreads that one may trade, but the data for it is available.
Looking at the OI figures of 6th August 2020 expiry, we can see that the range is slated to be between 11,000 and 11,500. This is very similar to what we observed last week and the market respected those ranges very nicely.
Oddly enough, we can see the put OI at higher strikes going down drastically while call OI continues to increase.
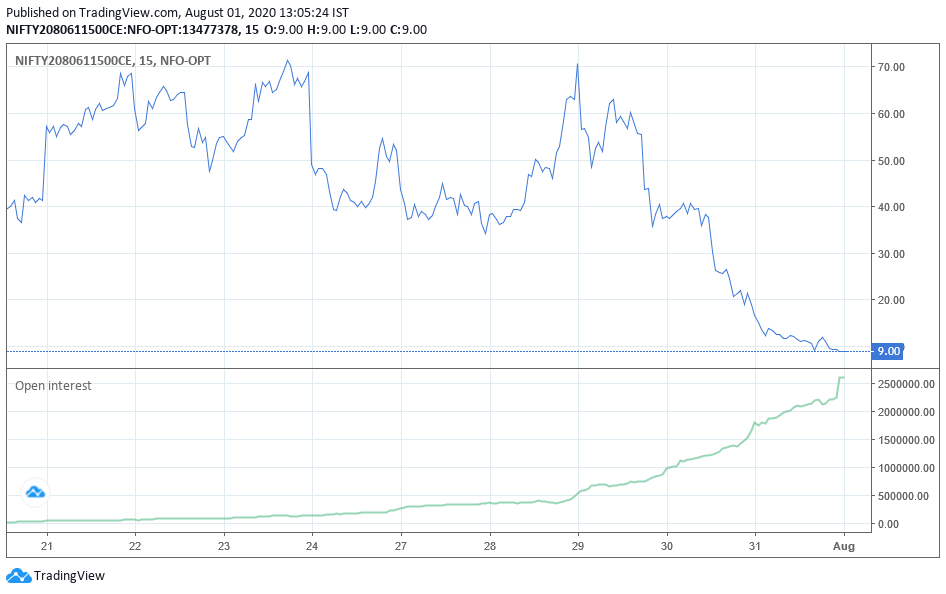
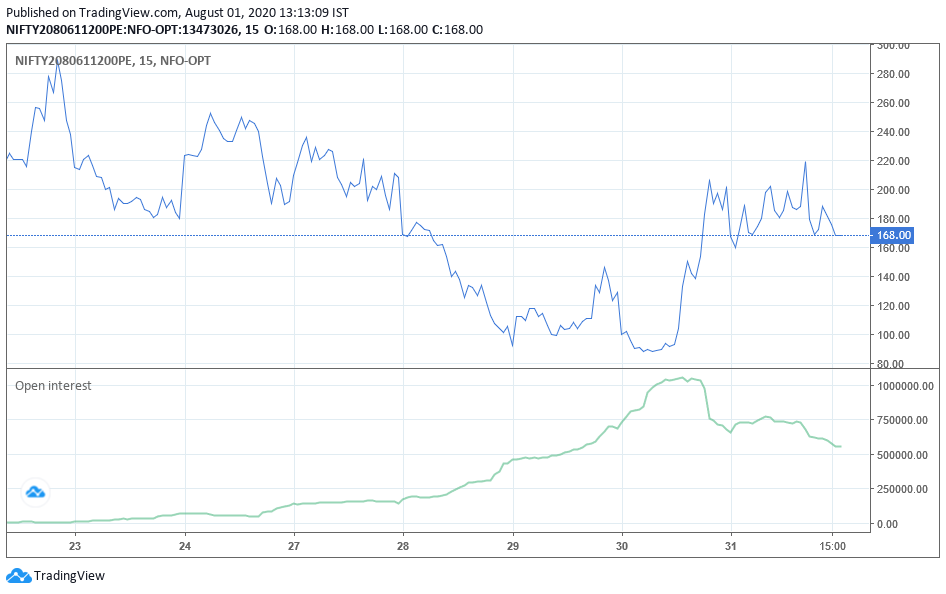
Chart1: 11500CE shows how option writers were in control since 29th July. It is unlikely that new writers will enter as 9 points is not a very high premium.
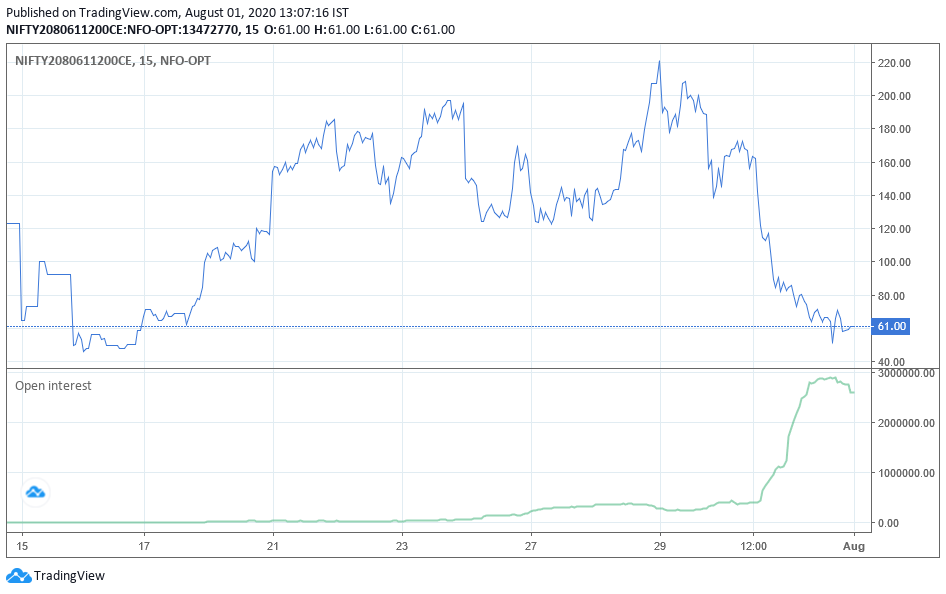
Chart2: 11200CE is more attractive to option writers as there is more premium to be earned, but with the market closing 11200+ on Friday, it has led to some writers covering their positions and booking profits.
Chart3: 11200PE had a good short buildup, but after the volatile expiry on 30th July, we can see that there was considerable short covering. It appears as if the bigger players are undecided whether 11200 will be held or breached by Nifty this week.
Heavyweights in the Nifty 50:
Let’s look at some important stocks in Nifty50 that collectively make up around 41.55% of NSE’s flagship broad market index. The analysis is done on both, Daily and Weekly timeframes. Charts displayed are either Daily or Weekly depending on which provides a clearer picture. We have used either line charts or candle charts on a case-by-case basis.
The weights used as per the most recent NSE press release available, dated June 30 2020. Compared to the previous period’s, this period has seen an increase in the weightages of the top five Nifty companies we feature.
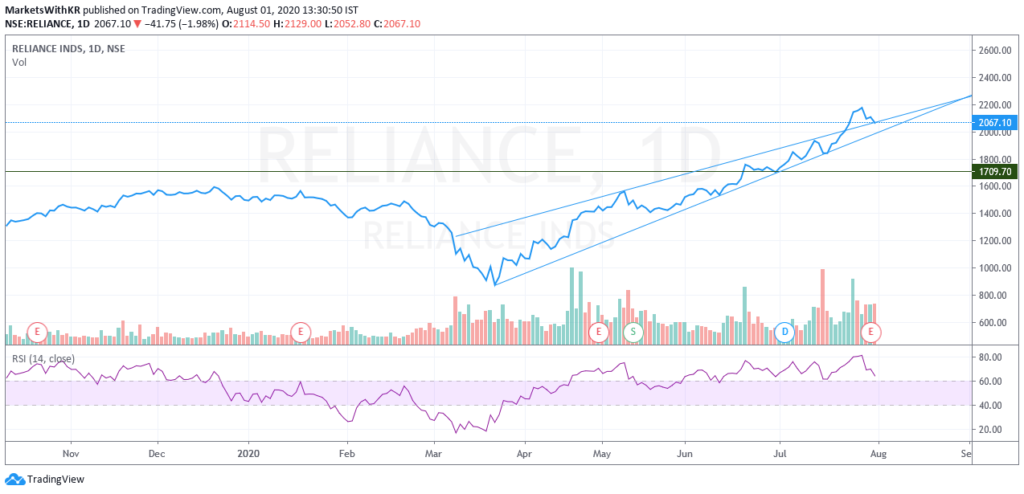
1. Reliance (12.45% weight): A lot has happened with Reliance in the past week. We last saw RIL on a candlestick which helped us better understand the trend as well as intraday range. This time, we use a line chart purely because it shows us the trend much better. This week saw RIL show some rather strong selling pressure (possibly from institutional participants). It has also been consistently high volume. Friday’s closing price now rests on an important trendline for the stock. The current level is quite crucial. 2030-2050 has been an important intraday demand zone and if breached, we may potentially see a 2000 retest soon. There have been some rather polarizing opinions on RIL’s valuation with many believing that the stock veers in the territory of being overvalued. This might have caused some profit booking as well after the incredible run it has had. This makes the coming week quite significant for RIL as continued selling pressure may indicate a lack of confidence despite a rather strong Q1 earnings announcement. Possibly the core petrochem business profitability faces mixed opinions. And since RIL is the highest weighted stock in Nifty50, it might have an impact on the broad market as well.
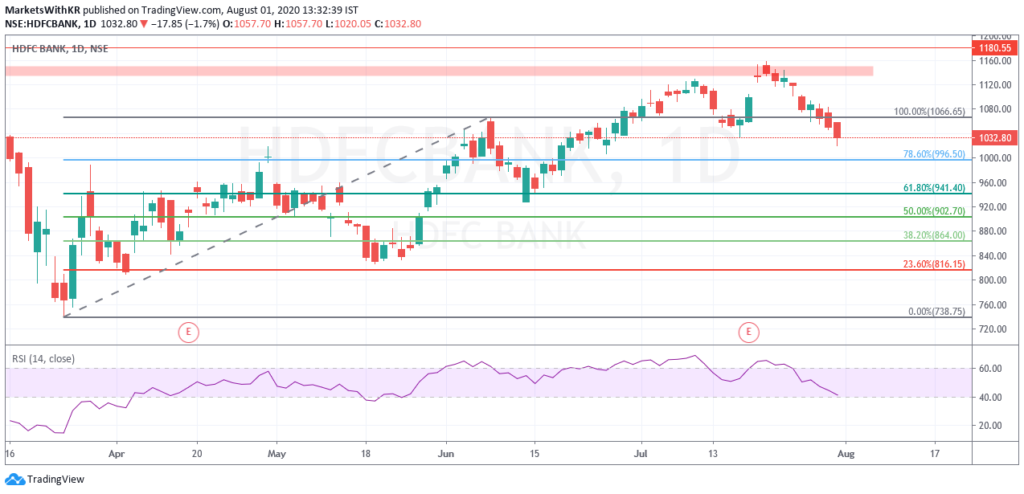
2. HDFCBANK (10.65% weight): Positivity did not last very long for the stock after a retest of the red highlighted area. While some buying pressure was seen, HDFC Bank opened with yet another gap last week and was unable to sustain the previous swing high and support zone. This brings HDFC Bank in a rather dangerous territory, with a 1000 retest likely if strong bulls can enter. This negativity was possibly due to Mr Aditya Puri selling 95% of his stake worth over RS. 840 crore. To the average investor, this might have sounded like a warning bell and hence we experienced strong selling. Interestingly, this is despite HDFC Bank reporting a fairly strong Q1 result which may further hint to this price dip caused by sentimental factors more than intrinsic financial factors.
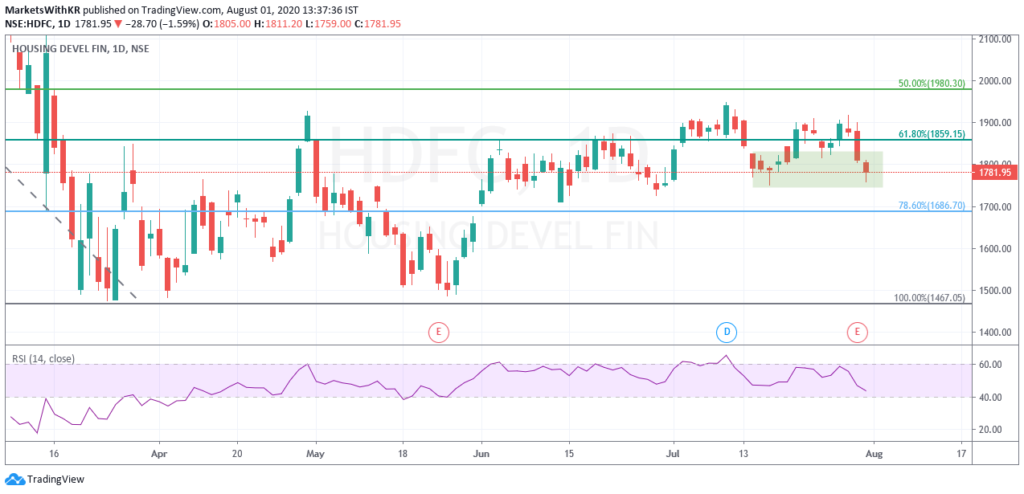
3. HDFC (6.99% weight): HDFC is back at a very crucial price level after yet another failed 1859 breach. The stock should remain strong overall as long as 1720-1745 is held. Interestingly, despite being one of the strongest stocks in the market, HDFC has underperformed quite severely and has not come close to recovering from the COVID-19 selloff yet. While on a broader scale, HDFC Bank has performed better, HDFC seems stronger in the past couple of weeks and is at a steadier level on the Daily chart. Q1 Earnings for HDFC were below some estimations which might have led to the stock facing some hurdles, but the overall positive outlooks still remain.
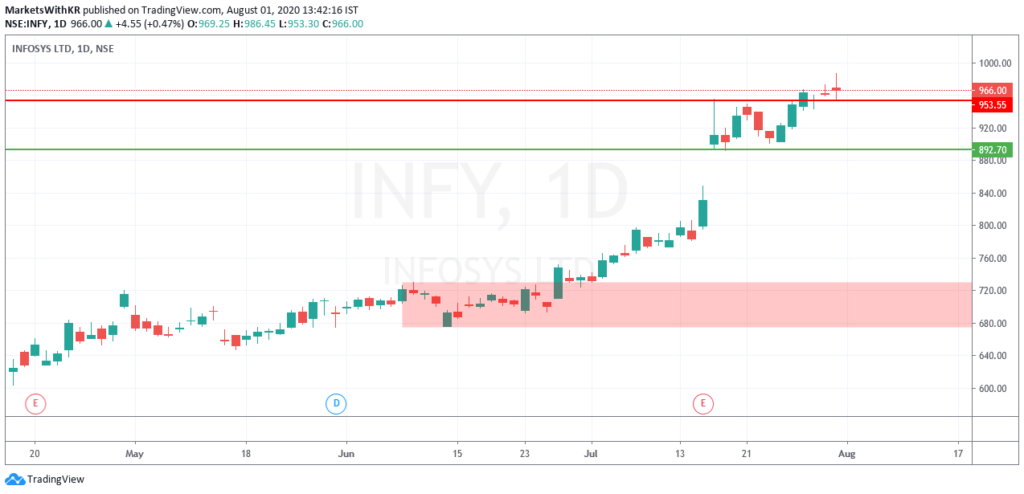
4. Infosys (6.21% weight): Infosys has had a terrific run this past week, setting a new ATH. However, Thursday’s and Friday’s closing candles show us some exhaustion at higher levels. This is confirmed by the line chart (not pictured) which shows some hesitation at higher levels. This does not necessarily make Infy bearish, but rather might indicate some hesitation or profit booking. The past two weeks have been very kind to the IT industry in general and this has helped Infy gain considerably. TCS, while not a part of our analysis today, made a new high as well (just to give you an idea of how good IT has been). If 950 is held and higher levels are respected, we should see Infy attempting the single-comma club and testing 1,000.
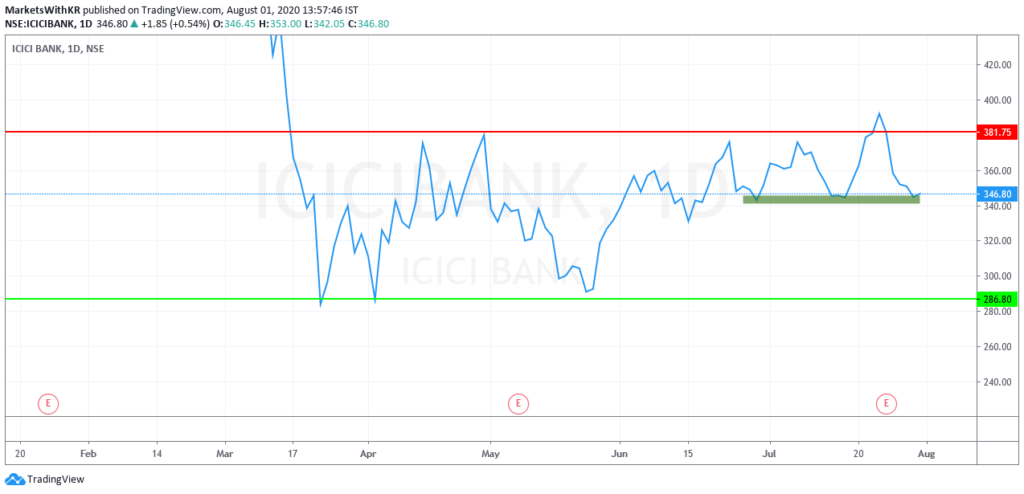
5. ICICI Bank (5.25%): ICICI Bank continues facing resistance from 380+ levels despite showing us strong moves when we last spoke about it. The good thing is that it has come to an accumulation zone right now as as long as 340 levels are held, ICICI Bank may attempt to breach the resistance marked in the chart below.
Volatility:
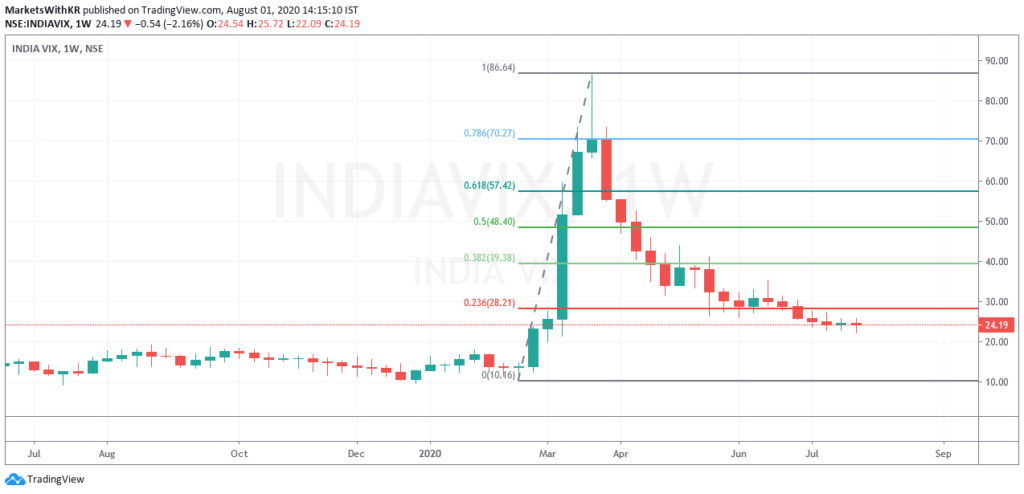
VIX continues to remain flat, but based on intraday price movements and overall sentiments, we believe that the actual price movements are not very well described by INDIA VIX this time around. If the markets continue climbing a wall of worry, we may continue seeing lower VIX levels, until it doesn’t. When VIX may just spike.
The point we intend to drive here is that VIX does not move solely based on the chart’s support and resistances. Hence, keeping in mind that uncertainty still exists, it would not be appropriate to decisively conclude that VIX is stabilizing.
Additionally, VIX appears to have a support at 20 which may be the next hurdle if it falls after consolidating at 24 levels.
Another point worth considering is that VIX has not been falling as sharply as it did earlier and has effectively stagnated at these levels as we previously described. This could be a sign of reconsideration or it may be a sign that the volatility has found a comfortable place at these levels and may perhaps hint towards a new normal.
For your reference, a lower VIX (or lower volatility) is generally associated with price moves that are less choppier and more trending. It also results in lower option prices (due to a lower IV). But at the same time, the ATR (Average True Range) of the stock would be narrower.
If you’re new to technical analysis and would like to know how to read the charts below, here’s a quick guide!
Disclaimer:
We, Anosh Mody & Krunal Rindani shall take no responsibility for any losses occurring out of investment/trading decisions you make based on the contents of this article.
We are not SEBI registered investment advisors. This article is meant for educational purposes only, please consult your investment advisor before acting upon any information you see here.
We may or may not have open positions, kindly assume that we are biased.


