Market Chronicles for the week ended 24th July, 2020.
Nifty behaved as expected in the last week, making a strong gain and closing 2.68% in the green after taking out 200 DMA resistance last Friday! Most gains were contributed by the first 2 sessions.
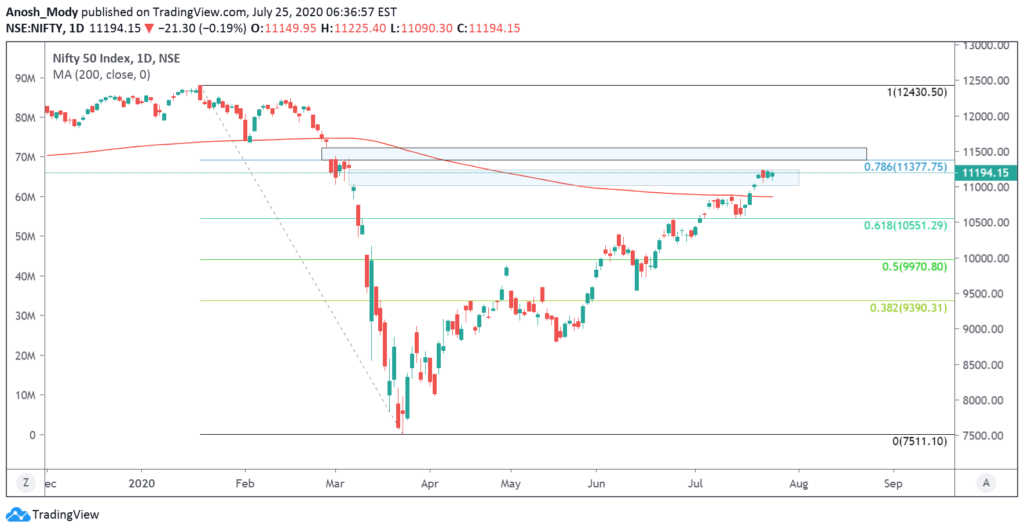
Our outlook remains BULLISH, with the possibility of a retest of 200 DMA, if the resistance at 11235 is not taken out.
Please read on to understand our rationale. This article contains an analysis of technical parameters as well as open interest and derivatives data. All the information below has hints for what levels to watch out for in weekly trade. Replicating these on your charting software and keeping an eye on them can help minimize unpleasant shocks in your trading.
Recap:
1) Faced major resistance at 11235, which is the gap ceiling. On the upside, 11377 is a major level to watch for
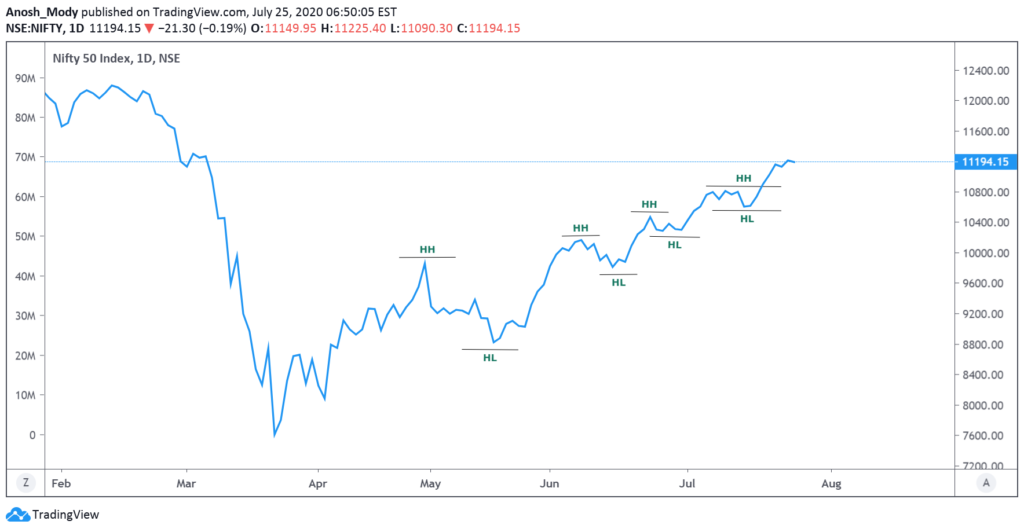
2) Uptrend is still intact; latest higher low is 10600
Moving Averages
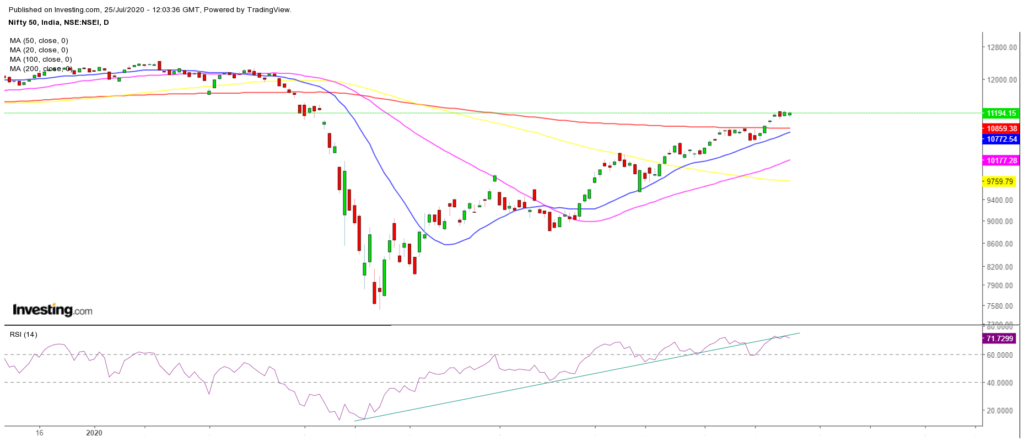
A quick snapshot of how the major Moving Averages are placed on the daily chart, as well as a look at the RSI indicator.
PS: We’re at the brink of seeing a golden crossover on the daily timeframe!
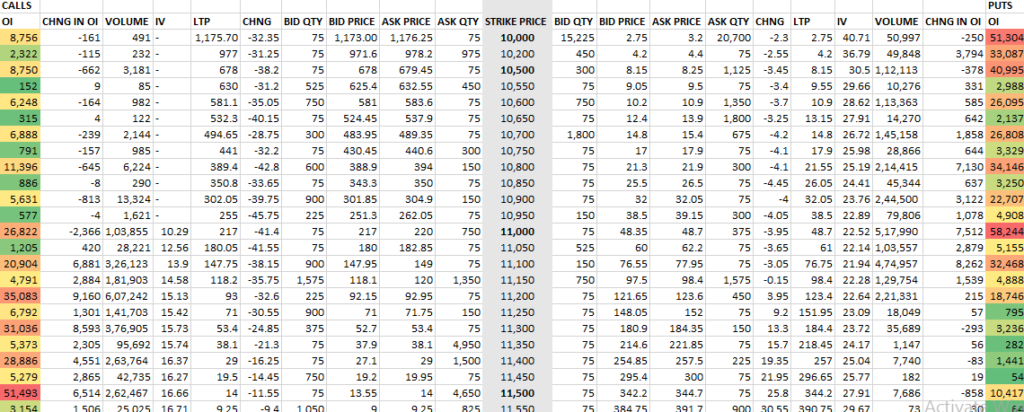
Open interest or OI is the total number of open positions in the market. A high OI indicates that there is a lot of activity in that instrument. It does not indicate buyers and sellers individually but is instead a more holistic measure, i.e. it is the number of contracts between the buyers and sellers, not the buyers and sellers on their own. One of the ways OI analysis works is that high-volume market participants would have sold strangles at strikes which leads to higher OI. This type of reading does not typically account for other types of spreads that one may trade, but the data for it is available.
Looking at the OI figures of 30th July 2020 expiry, we can see that the range is slated to be between 11,000 and 11,500. Unlike the prior two expiries, the OI at these strikes is quite high. Earlier we saw OIs of around 20,000-30,000. This number is now 2x.
The range of 500pts sounds quite narrow – similar to what we witnessed last week – but most psychological levels like 12000, 11500, 11000, 10500, etc have a high OI which means that many market participants expect this coming week to have some larger moves.
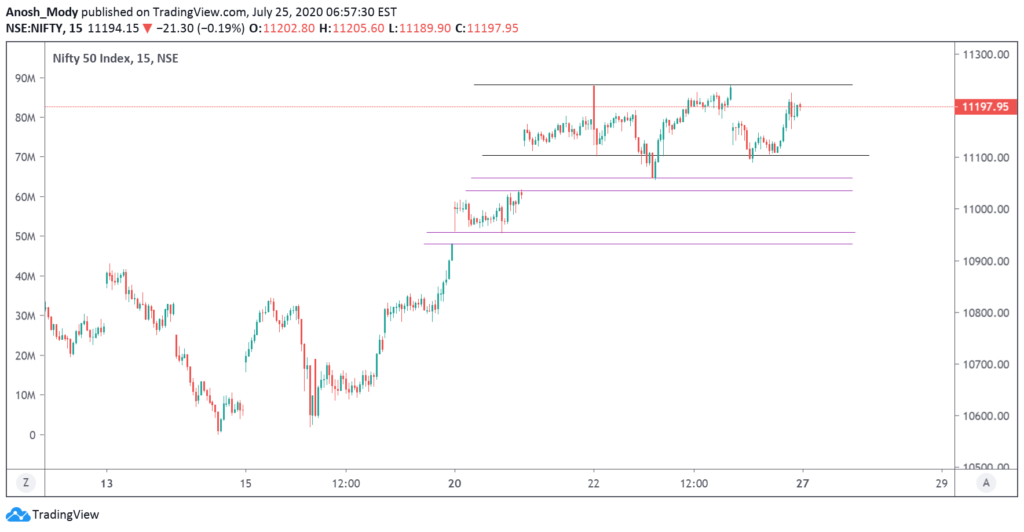
At the moment, Nifty is consolidating between a right range of 11240 and 11000 which may be why a breakout/large move is expected.
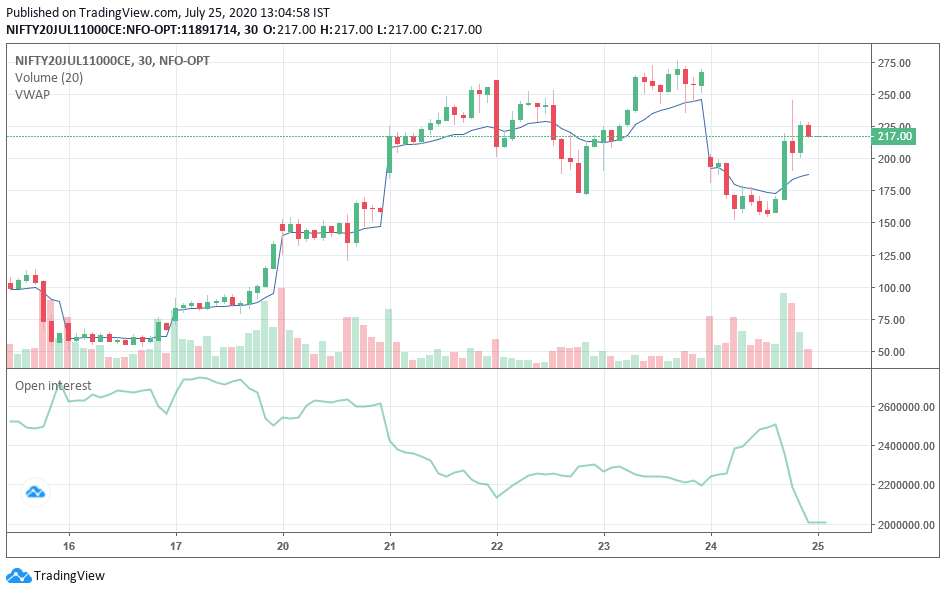
The OI charts show clear short covering on lower strike call options. Below is an 11000CE chart which shows how call writers were forced to exit their positions towards the end of the day. This is because the day was relatively bearish to begin with, but the sudden price spurt might have triggered the short covering. Some participants with conviction may prefer to write ITM calls as it gives a better premium credit. This is risky, but it’s important to note that not everyone would have naked short positions.
Apart from this, we continue to see the standard “increase in OI + fall in prices” with the higher strike calls and lower strike puts.
short covering is when the short party “covers” their position, i.e. squares off their short position by buying back the security. This leads to an increase in price as there is a sudden buying pressure.
Heavyweights in the Nifty 50:
Let’s look at some important stocks in Nifty50 that collectively make up around 41.55% of NSE’s flagship broad market index. The analysis is done on both, Daily and Weekly timeframes. Charts displayed are either Daily or Weekly depending on which provides a clearer picture.
The weights used as per the most recent NSE press release available, dated June 30 2020. Compared to the previous period’s, this period has seen an increase in the weightages of the top five Nifty companies we feature.
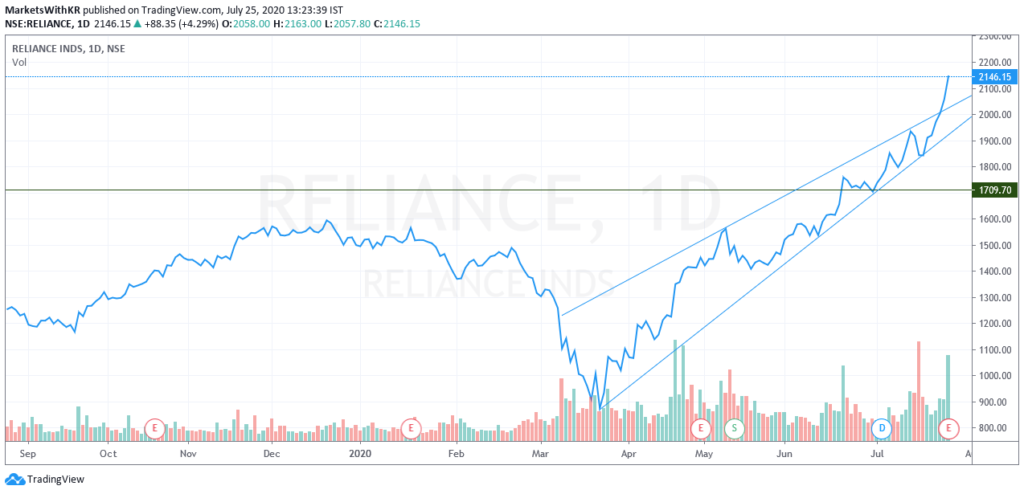
1. Reliance (12.45% weight): This was another very eventful week for Reliance. The stock has now broken into the world’s top 50 valuable companies and is the second largest energy company in the world. This is thanks to the stock breaching the price barrier. The Q1 Earnings of Reliance are expected on July 30th which may result in some rather volatile moves for yet another week. On the charts, Reliance has had one of the steepest climbs of any stock, especially large cap. Below is a line chart of Reliance as it better indicates how clean – and steep – the uptrend has been.
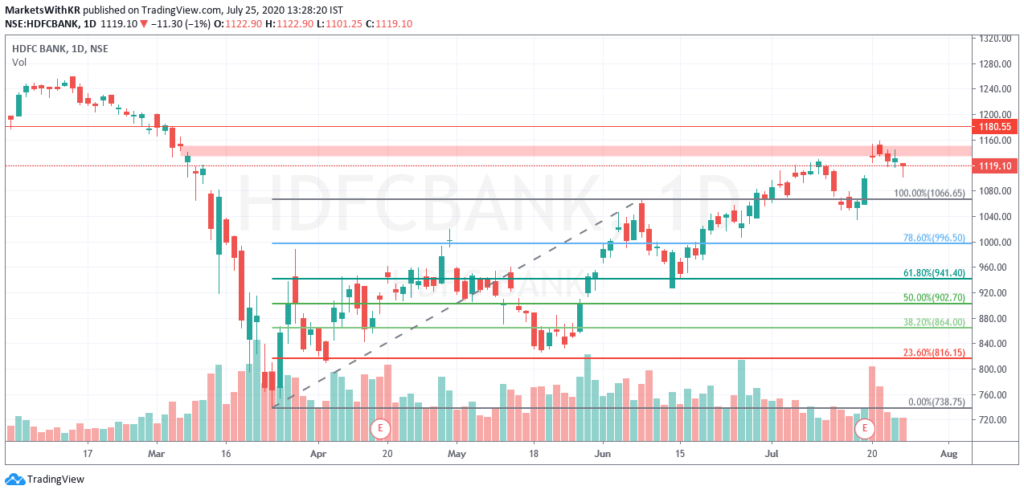
2. HDFCBANK (10.65% weight): HDFC Bank has turned back from the caution area we had highlighted last week. While this is not a bullish sign, it does seem to be enjoying reasonable buying pressure at lower levels. Once the highlighted level is cleared, we could expect the stock to test 1180, with 1066 as an important support.
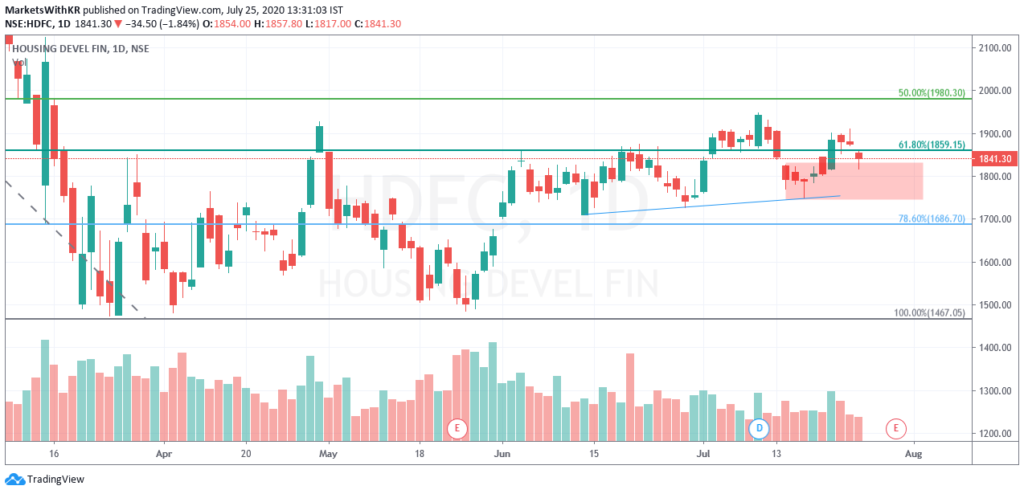
3. HDFC (6.99% weight): After managing to break out of the ‘caution zone’ we had marked in red last week, HDFC was unable to sustain higher levels and is now back to the highlighted zone, now taking support. All things considered, HDFC (and HDFC Bank as well) seem to be experiencing reasonable buying and hence as long as the week starts off on a positive note, the stocks may continue to explore higher levels.
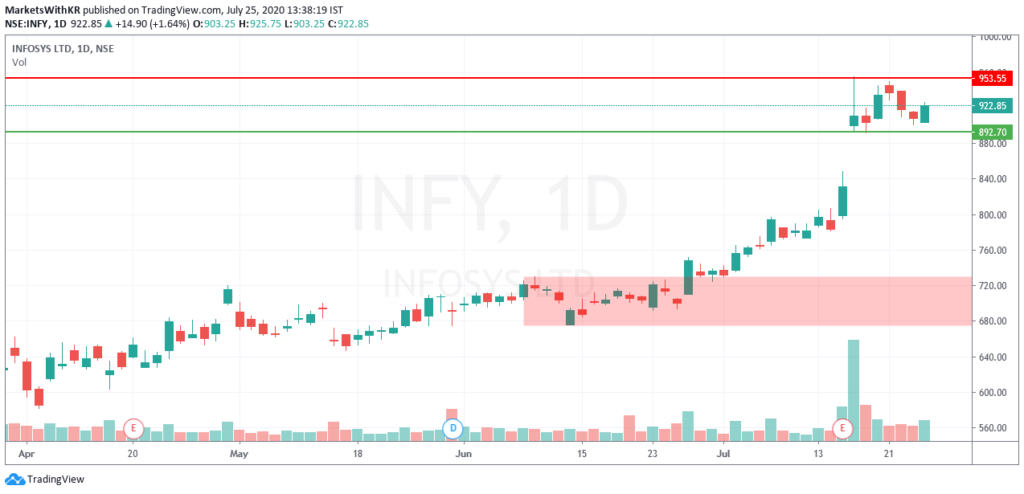
4. Infosys (6.21% weight): Infosys has accepted 900 levels for now. This is evident by the good support it took at lower levels, without even attempting a gap filling. INFY might move range bound between 953 and 892, with stronger moves coming in once these levels are breached. The rationale behind these levels is that they are new support and resistance zones for the stock, around which a lot of orders would be placed.
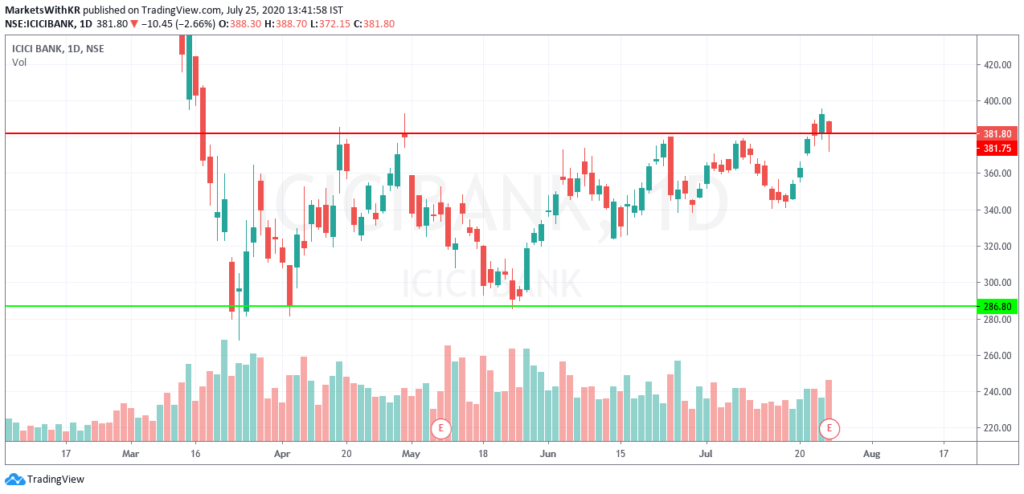
5. ICICI Bank (5.25%): ICICI Bank has successfully breached its resistance after a spectacular past week. This could be in anticipation of a strong Q1 Earnings report. After breaking out of the resistance at 380, it did attempt lower levels on Friday (banking in general was sluggish on that day), but managed to stay above the support by day’s close. If 395-396 can be breached, we could be looking at resistance around 410-415 in this coming week. 360-370 would be important support levels.
Volatility:
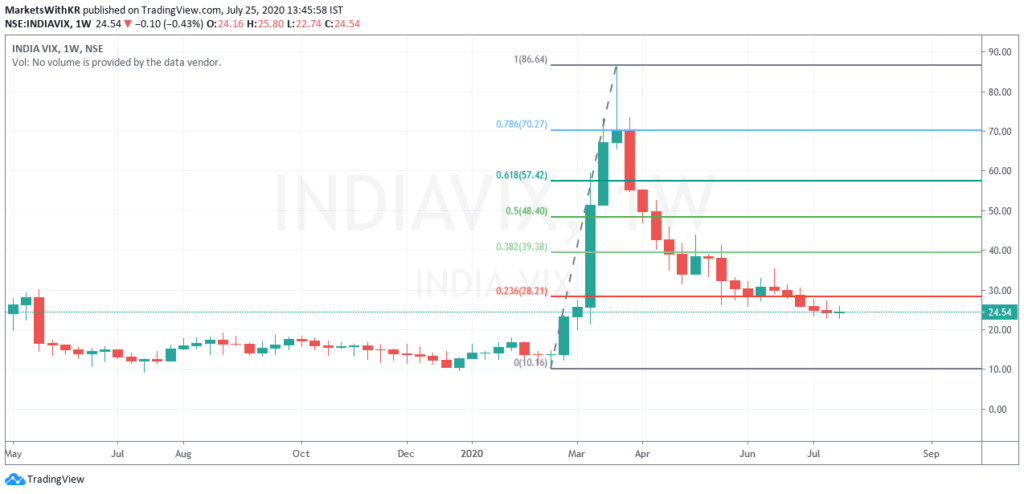
VIX continues to fall, but based on intraday price movements and overall sentiments, we believe that the actual price movements are not very well described by INDIA VIX this time around. If the markets continue climbing a wall of worry, we may continue seeing lower VIX levels, until it doesn’t. When VIX may just spike.
The point we intend to drive here is that VIX does not move solely based on the chart’s support and resistances. Hence, keeping in mind that uncertainty still exists, it would not be appropriate to decisively conclude that VIX is stabilizing.
Additionally, VIX appears to have a support at 20 which may be the next hurdle.
After slowing its descent, VIX has shown the first green candle in five weeks. This does not mean that VIX would be on its way back up, but it rather means that last week saw a very tough fight between the bulls and the bears. Intraday moves would confirm this increased volatility.
For your reference, a lower VIX (or lower volatility) is generally associated with price moves that are less choppier and more trending. It also results in lower option prices (due to a lower IV). But at the same time, the ATR (Average True Range) of the stock would be narrower.
Disclaimer:
We, Anosh Mody & Krunal Rindani shall take no responsibility for any losses occurring out of investment/trading decisions you make based on the contents of this article.
We are not SEBI registered investment advisors. This article is meant for educational purposes only, please consult your investment advisor before acting upon any information you see here.
We may or may not have open positions, kindly assume that we are biased.


