Market Chronicles for the week ended 14th November, 2020.
If you’re new to technical analysis and would like to know how to read the charts below, here’s a quick guide! https://www.investopedia.com/trading/candlestick-charting-what-is-it/
To start out, we’d like to wish all our readers and well wishers a very Happy Diwali, and a bright and prosperous new year!
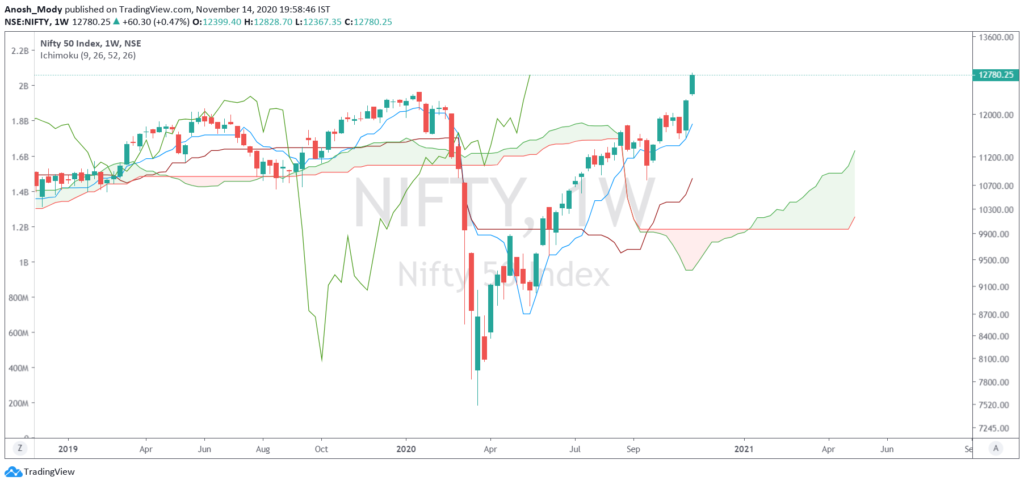
Nifty ended the week (and Samvat 2076) at an All Time High, gaining 4.2% in the week! Our bullish thesis played out well, and we are now at the trendline joining 3 previous tops.
While this is a mild cause for concern, we maintain that the markets are in a firm uptrend, and we remain BULLISH going forward.
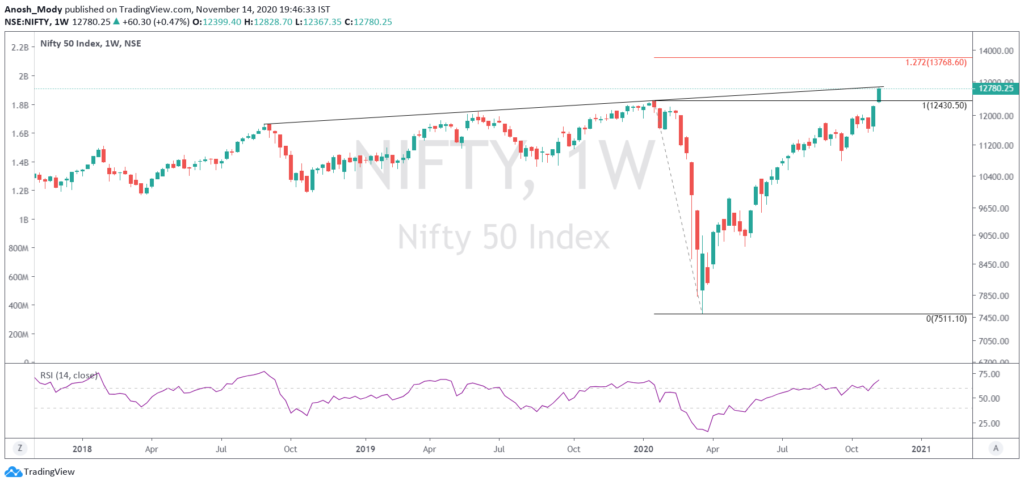
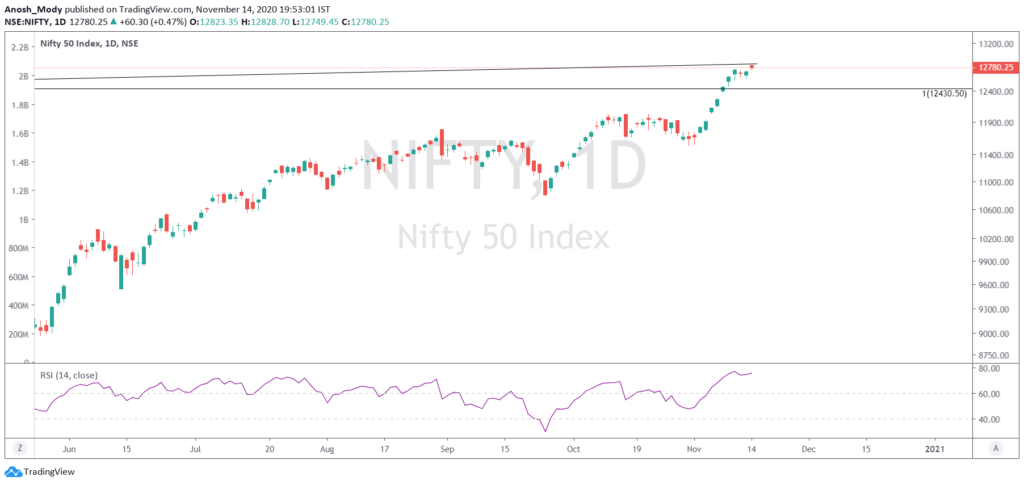
Please read on to understand our rationale. This article contains an analysis of technical parameters as well as open interest and derivatives data. All the information below has hints for what levels to watch out for in weekly trade. Replicating these on your charting software and keeping an eye on them can help minimize unpleasant shocks in your trading.
Note: Our directional views are subject to sudden and drastic change mid-week. For anyone who wants a daily update on the stock markets, we suggest you follow us on Twitter, for some more frequent insights. Our handles are @anoshmodyy and @MarketsWithKR
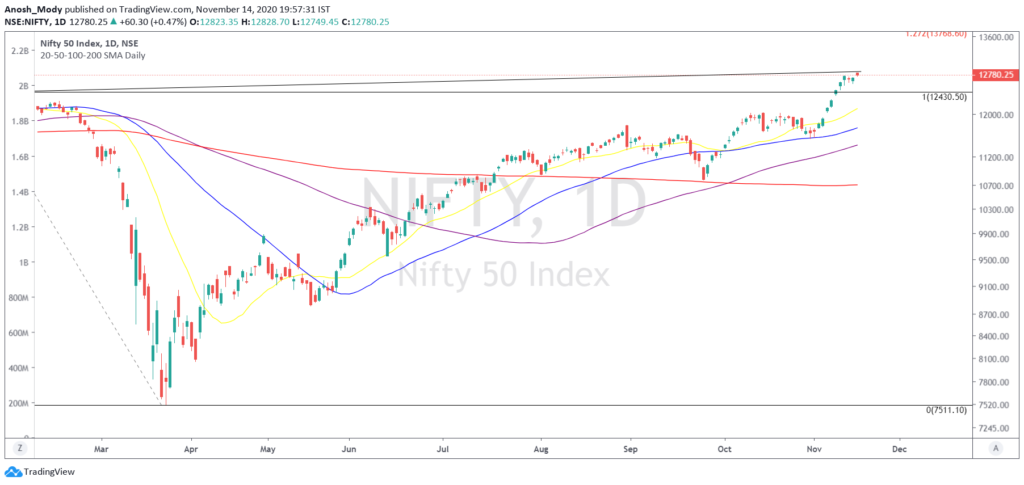
Moving Averages
A quick snapshot of how the major Moving Averages are placed on the daily chart.
Ichimoku (D)
Very bullish setup on this trend following indicator, Price above cloud, which is green. Tenkan and Kijun sen pointing up, with a free chikou span.
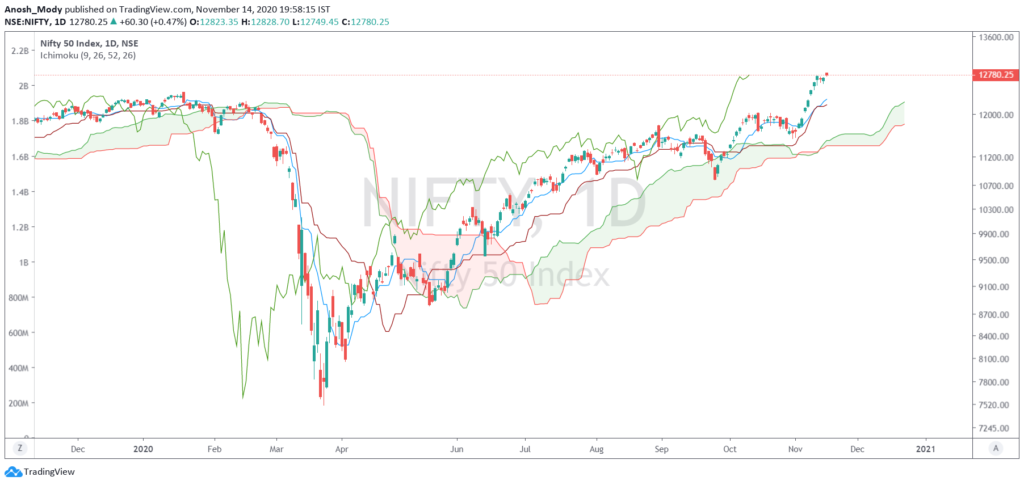
Ichimoku (W)
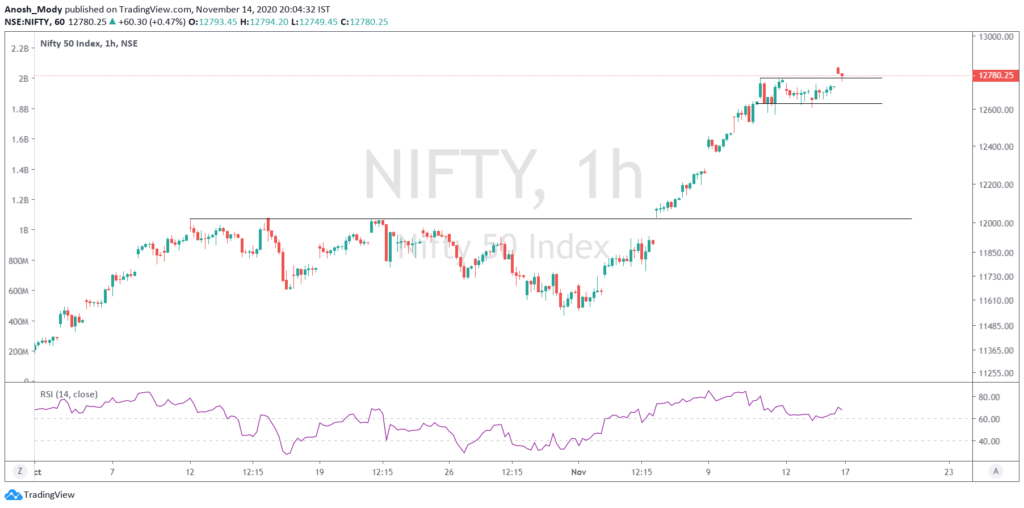
Nifty Intraday
The extended week was ended with the Muhurat session giving a breakout and retest of the initial range. If the highs of 12770 are held, we can expect a move higher next week as well.
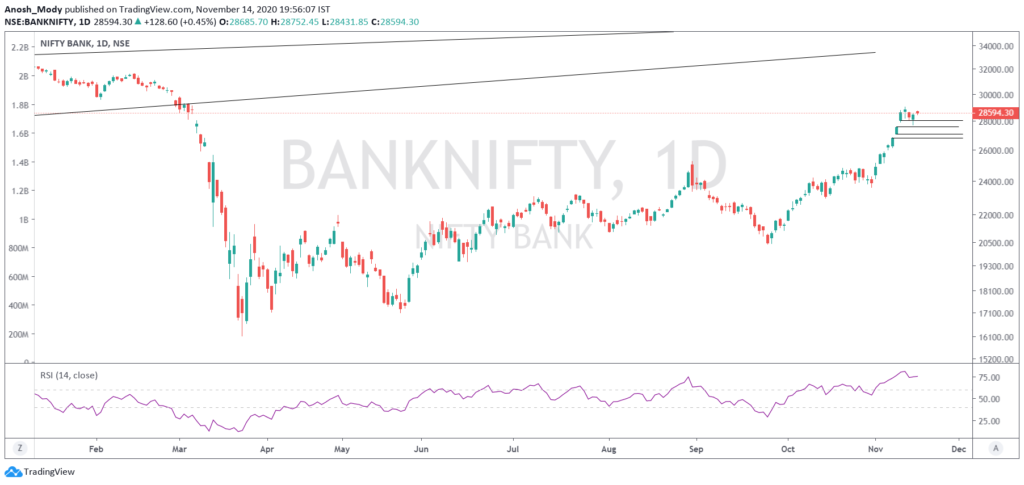
Bank Nifty
The index remained strong this week, gaining ~6%. A few major gap supports are marked on the chart.
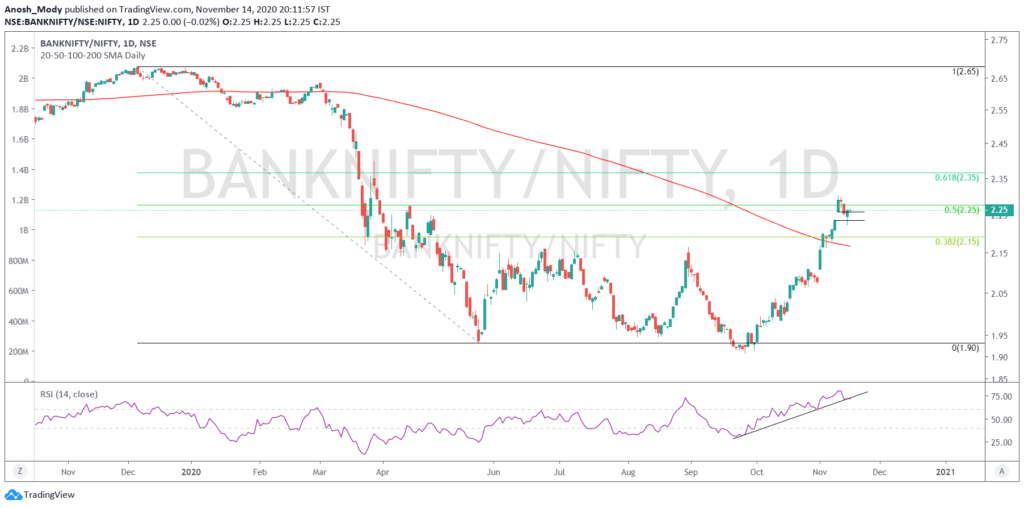
Bank Nifty / Nifty (Relative Chart)
The relative strength chart looks strong. Bank Nifty is likely to remain strong vs Nifty.
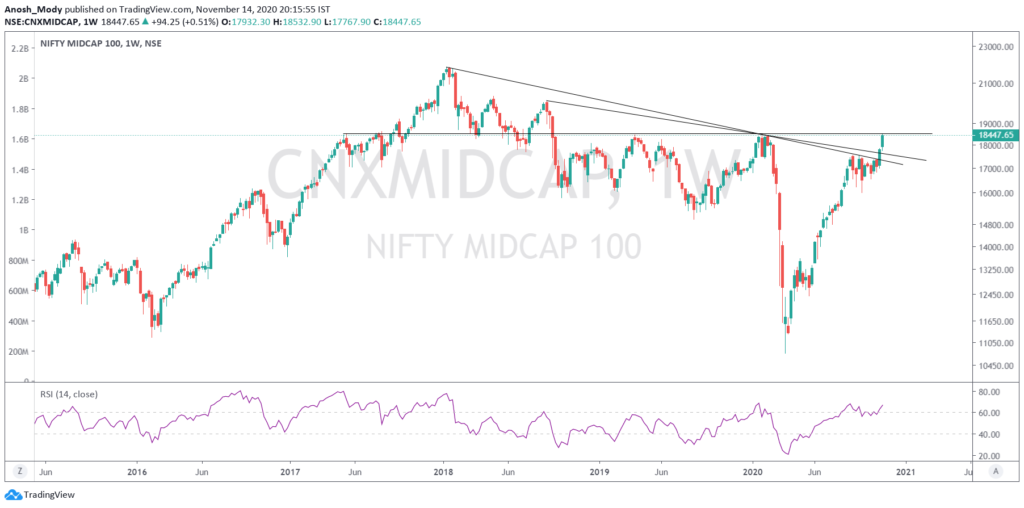
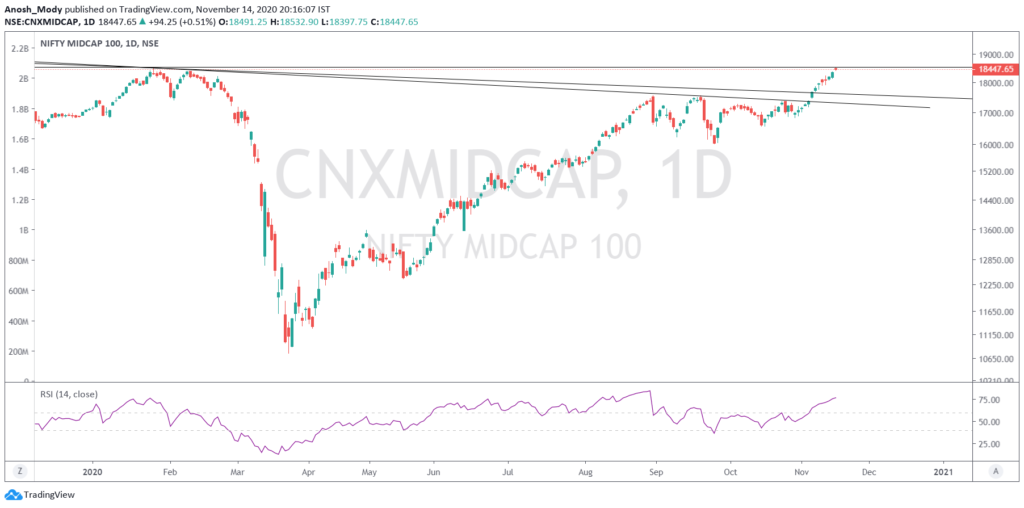
Nifty Midcap 100
The index did well after breakout. Mid caps appear to be quite strong. Currently at a horizontal supply zone.
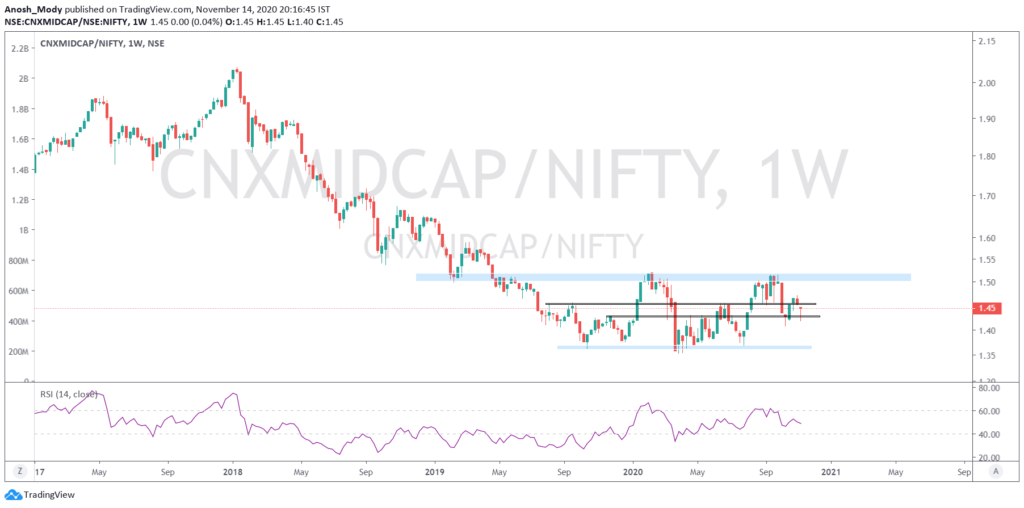
Nifty Midcap 100 vs Nifty 50
The relative strength chart rejected lower levels, as midcaps outperformed in the second half of the week.
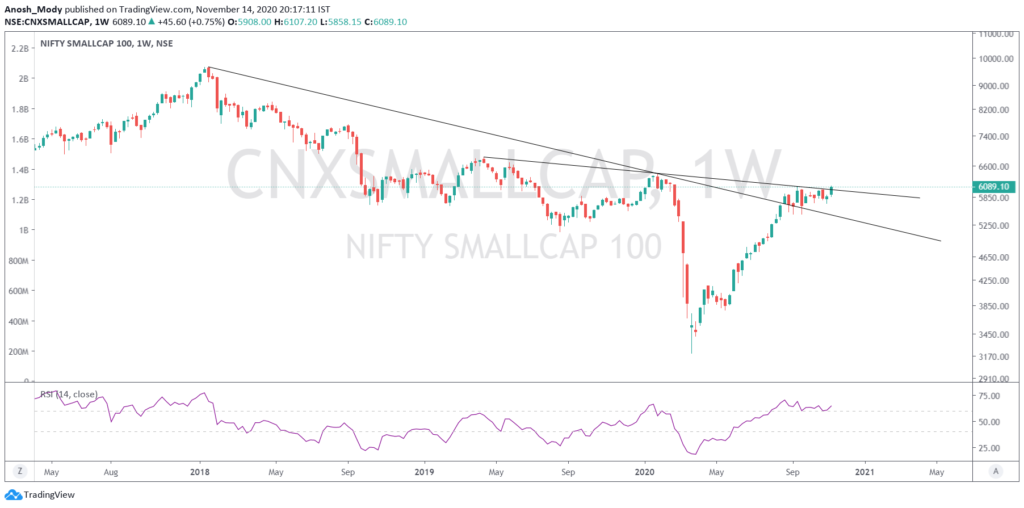
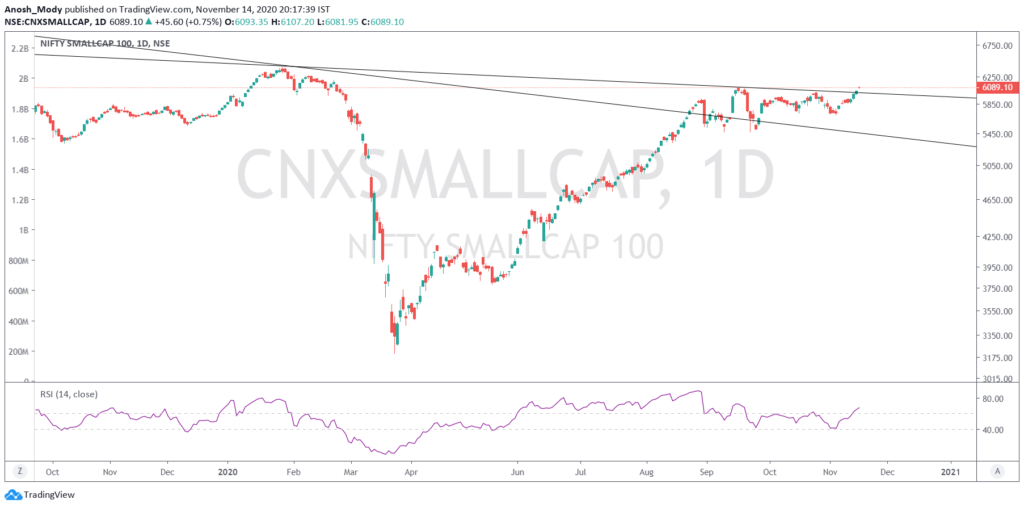
Nifty SmallCap 100
The index broke out of the confluence of major horizontal and diagonal trendline resistance this week.
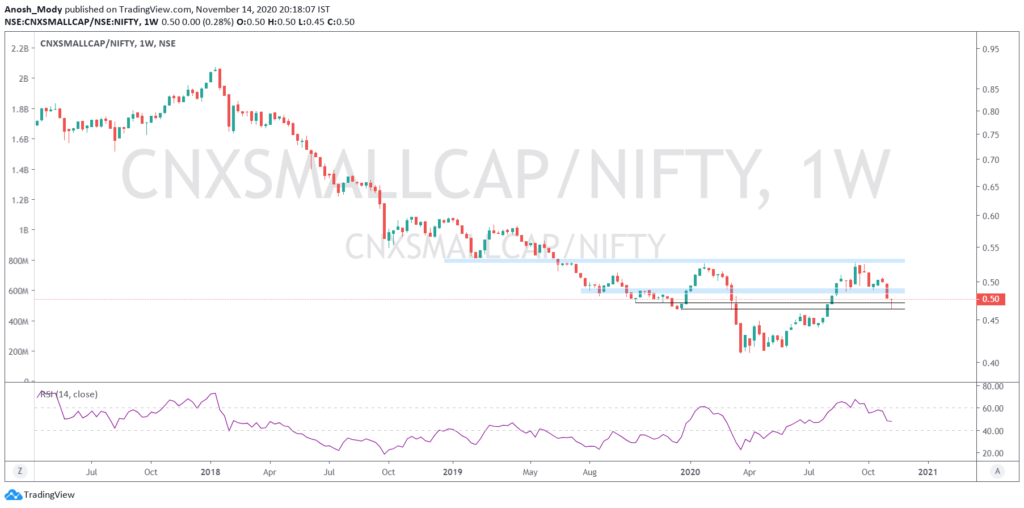
Nifty Smallcap 100 vs Nifty 50
The relative strength chart rejected lower levels, as smallcaps outperformed in the second half of the week.
Currency
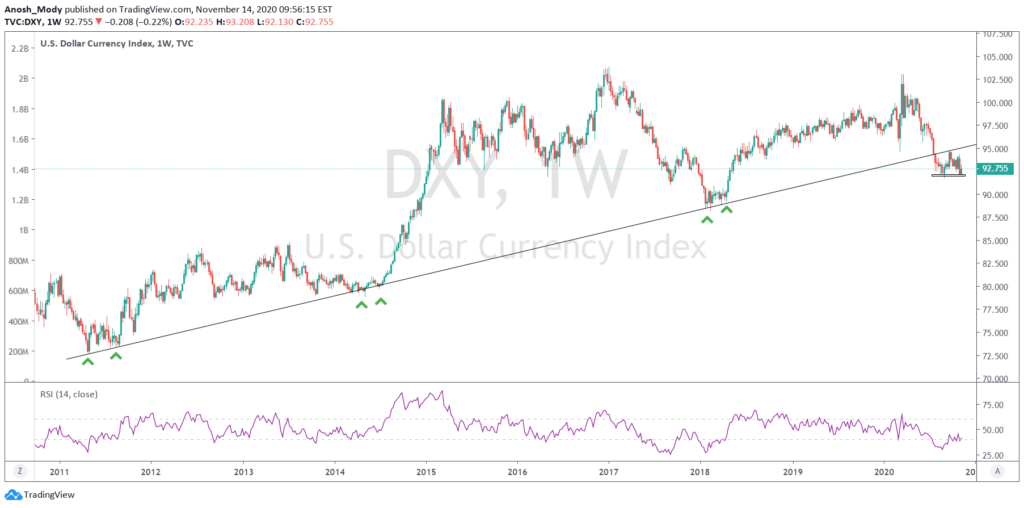
DXY
The Dollar Index refused to move below 92 just yet. Currently remains range bound and undecided. A falling DXY is positive for equities.
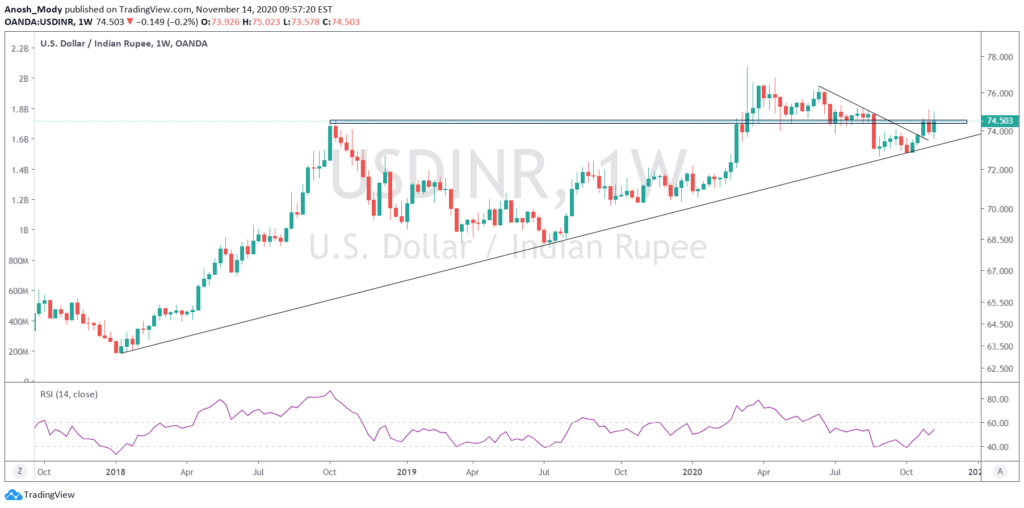
USDINR
The currency pair is at a historical CIP level. 74.4-74.5 remains a crucial resistance level
OI Analysis:
Open interest or OI is the total number of open positions in the market. A high OI indicates that there is a lot of activity in that instrument. It does not indicate buyers and sellers individually but is instead a more holistic measure, i.e. it is the number of contracts between the buyers and sellers, not the buyers and sellers on their own. One of the ways OI analysis works is that high-volume market participants would have sold strangles at strikes which leads to higher OI. This type of reading does not typically account for other types of spreads that one may trade, but the data for it is available.
Nifty
Nifty seems to have accepted levels above previous ATH very well as the put OI is still ~400pts above the prev ATH. This shows how much positivity there has been this past week or so.
The highest put OI is also just 80pts away from CMP which shows that the bulls are willing to defend that level very aggressively and want to get max premium from that option. This is generally when bulls have a high level of conviction in the trend.
Highest call OI at 13k makes sense as it is an important psychological level. Bears may try and defend the level, but on a broader view, many are expecting the real rally to begin once 12,800 is breached. If this is true, the bears at 13k may just be speculating for a narrower move in the broader uptrend, or their position may be a part of their strategy. If the above hypothesis of the rally just starting isn’t true, we may see a sharp pullback as put writers at lower levels might have to cover positions swiftly.

Bank Nifty
The range and OI structure overall is similar for BN, too. The only downside for Banknifty here is that underlying banks seem to be at resistances. Unless HDFC Bank, the leader, is able to continue the positivity it experienced in the second half of Friday, it may be an uphill climb.
Apart from this, directionally speaking, our view is similar to what we shared in Nifty’s OI analysis.

Heavyweights in the Nifty 50:
Let’s look at some important stocks in Nifty50 that collectively make up around 43.68% of NSE’s flagship broad market index. This figure is lower than last month’s which means that the weightage occupied by the top five stocks has reduced. The only culprit for this is RIL which underperformed severely.
In today’s edition, we have used a lot of Fibonacci retracements. This is because many stocks are either retracing or have broken out and are nearing FIB extension zones.
On the chart front, we’ve used naked charts, for the most part, to display the price action better.
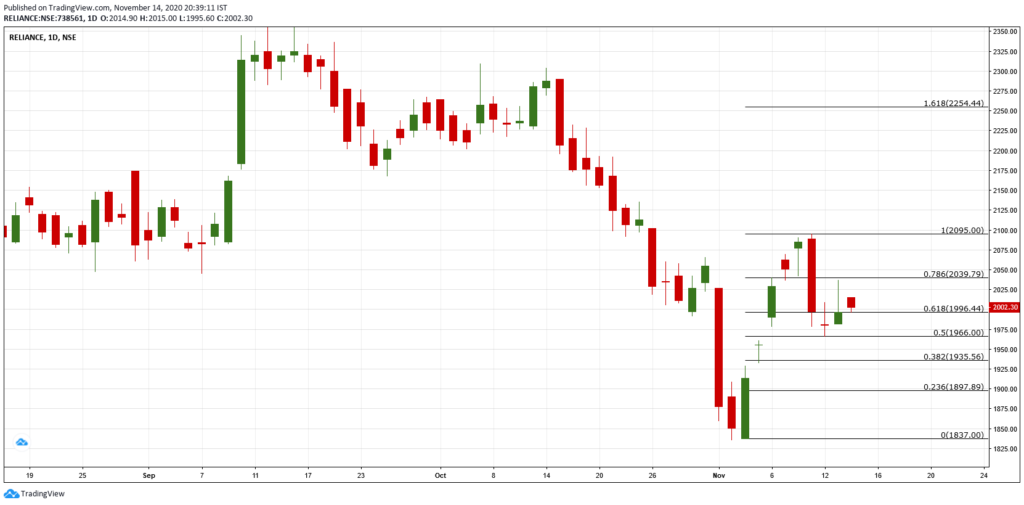
1. Reliance (13.24% weight): Reliance continued underperforming, but it seems to have found a bototm at ~2,000. We can see how price seems to be respecting the FIB level below. Despite broad-market being very positive, RIL didn’t support. One can only imagine what may happen when RIL wakes up, which it seems to be on its way to. Intraday selling pressure is still a bit hard to overcome though. (Read the Basics of Dow Theory and trend by clicking here).
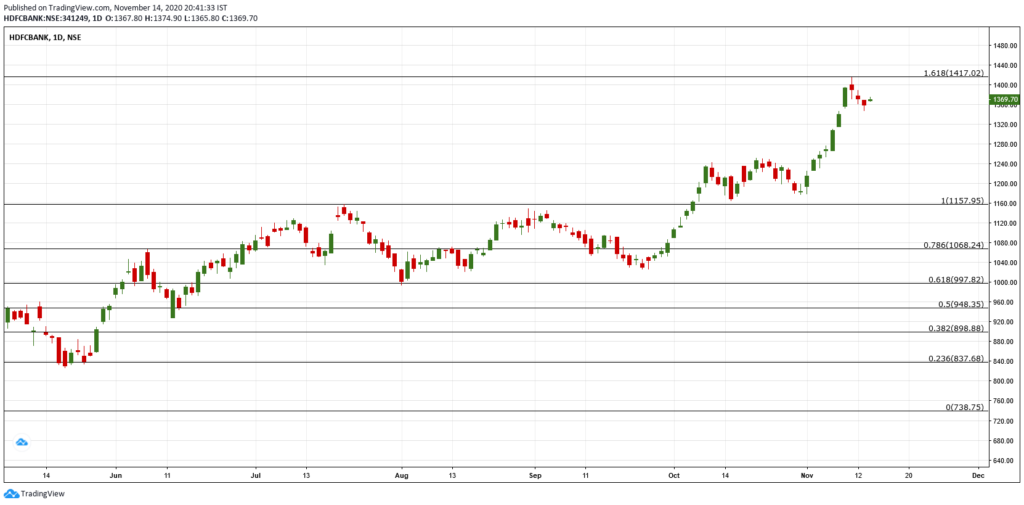
2. HDFCBANK (10.25% weight): HDFCBANK is turning back from a FIB extension resistance. This will be a key level. Friday’s candle shows good support from lower levels and if this bullishness continues, we may see Muhurat trading high being broken on Monday. Overall, the negativity is understandable as pre-Diwali profit-booking is common, especially when the stock has rallied up that strongly.
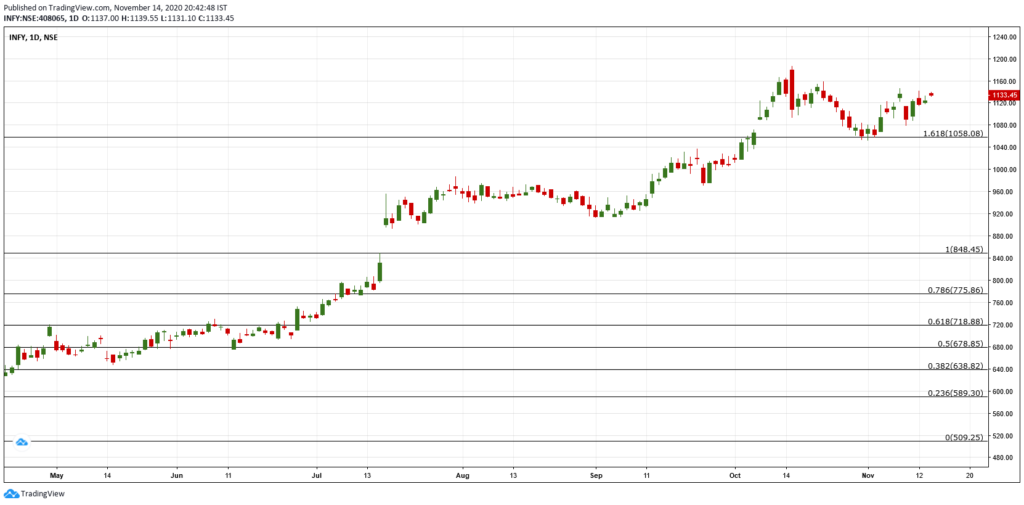
3. Infosys (7.74% weight): Infy has seen some mixed moves this past week. It is approaching CIP resistance, after which it should be able to make stronger moves. In the past few days, it has successfully made higher lows, but the intraday moves aren’t as strong as the gap up opens. The stock may be waiting for a news trigger to continue its rise.
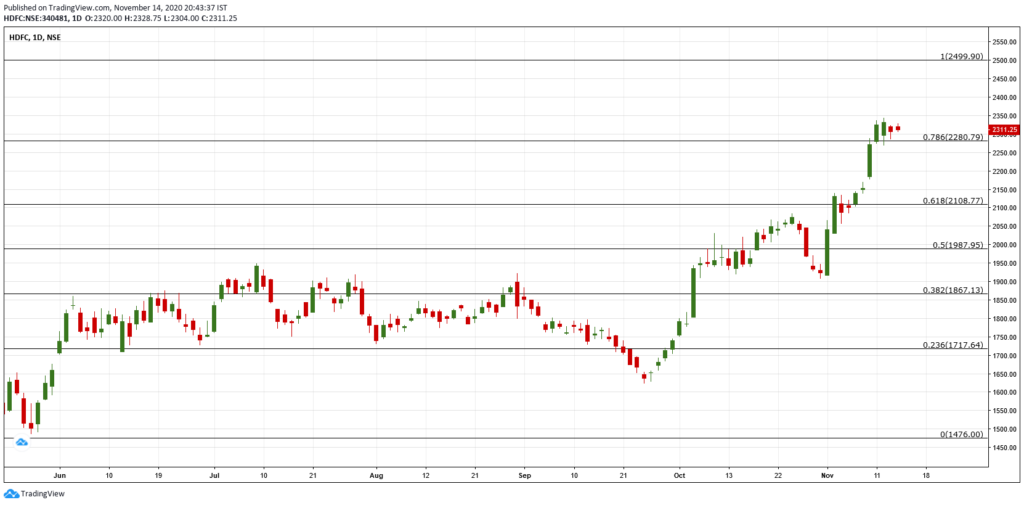
4. HDFC (6.87% weight): HDFC should be bullish as long as the FIB support is held. It is consolidating, and the last time this happened, HDFC saw some strong moves. However, the chart shows us that it’s known for fake-outs. For instance, it only went up after trapping bears by breaking a support earlier in September. Similarly, in October/November, it only shot up after not clearing a FIB resistance. Best to be cautious!
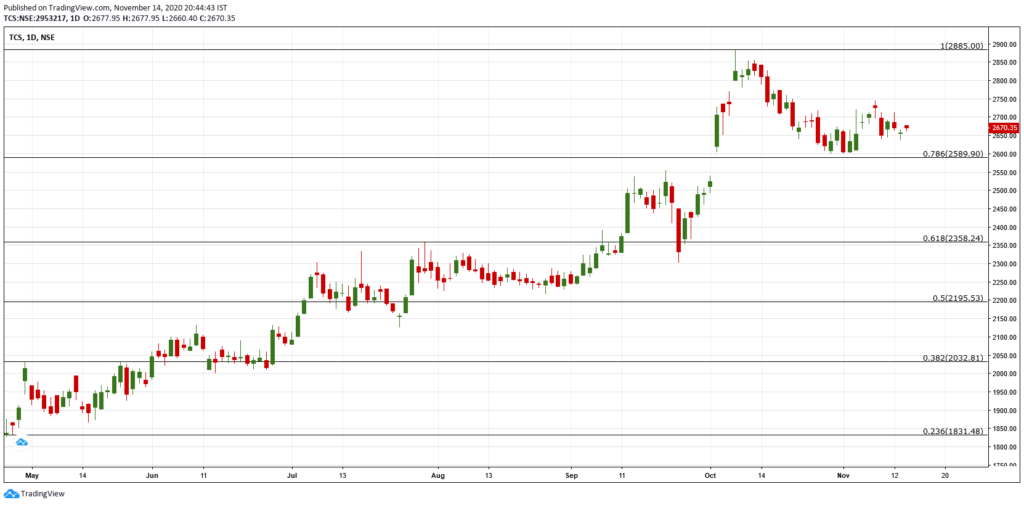
5. TCS (5.58%): Like Infy, TCS too is almost moving sideways. However, it hasn’t made clear higher lows after bouncing up from support. Intraday moves seem to be favouring sellers as the prices seem suppressed, but buying at lower levels is clear. Holding 2640 will be key.
Heavyweights in Banknifty:
Since we have started analysing Banknifty in Market Chronicles, we decided to include some top movers of Banknifty. The number one mover is HDFC Bank, which has already been spoken about in the previous section, so we will discuss two other important stocks here, namely Kotak Bank and SBI. Other banks have an impact on the index, but these along with ICICI Bank are typically the movers.
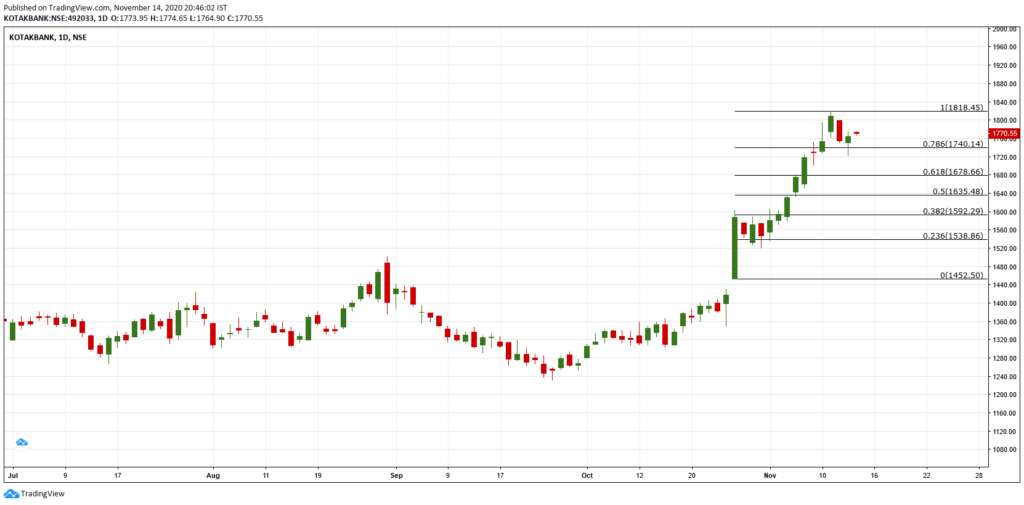
1. Kotak Bank: After a smashing performance, Kotak had retraced, possibly due to profit booking, and is bouncing up from support now. As long as Friday’s low is held, we should see bulls in control.
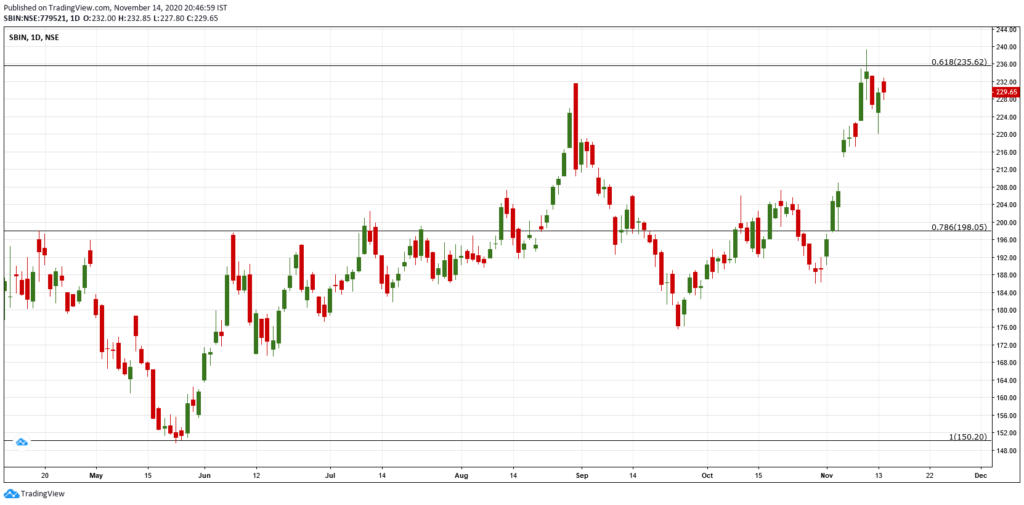
2. SBIN: This stock has been a surprising gainer in the past week. After consolidating post gap-up, it possibly cleared out all the weak hands before shooting up. However, we can see that it’s caught right under an important supply zone. If overall sentiment is good and there is some positive news trigger, SBIN could clear a very important level that it hasn’t stayed around since the COVID selloff.
Volatility:
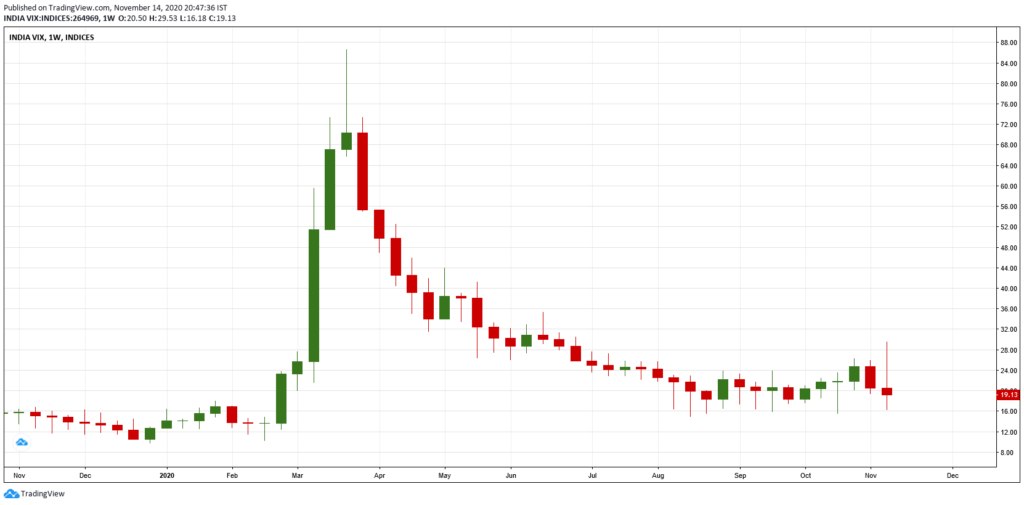
The week has shown some very odd moves in India VIX. Even though the market is trading around ATH, VIX is still far above the normal range. In fact, despite a spike in prices, we can see there’s been a corresponding spike in VIX too!
Since VIX is derived from option prices, it is possible that the options may be mispriced to factor in the uncertainty along with other elements. Or there could be something cooking. Either way, it’s a great market to learn more!
For your reference, a lower VIX (or lower volatility) is generally associated with price moves that are less choppier and more trending. It also results in lower option prices (due to a lower IV). But at the same time, the ATR (Average True Range) of the stock would be narrower.
Disclaimer:
We, Anosh Mody & Krunal Rindani shall take no responsibility for any losses occurring out of investment/trading decisions you make based on the contents of this article.
We are not SEBI registered investment advisors. This article is meant for educational purposes only, please consult your investment advisor before acting upon any information you see here.
We may or may not have open positions, kindly assume that we are biased.
Anosh Mody is an MBA student from SBM, NMIMS Mumbai. However, the views reflected in this article are strictly his own, and in no way reflect upon the B-School in any manner.
Follow Us @


