Market Chronicles for the week ended 1st October, 2020.
If you’re new to technical analysis and would like to know how to read the charts below, here’s a quick guide! https://www.investopedia.com/trading/candlestick-charting-what-is-it/
Nifty had a very rough September, but the end was a lot better than the beginning. The month ended just 1.23% in the red, and the last week ended 3.3% in the green!
The index is at a precarious level for us to give a concrete directional view, but given the strength seen in the first candle of October, we are CAUTIOUSLY OPTIMISTIC on Indian equities.
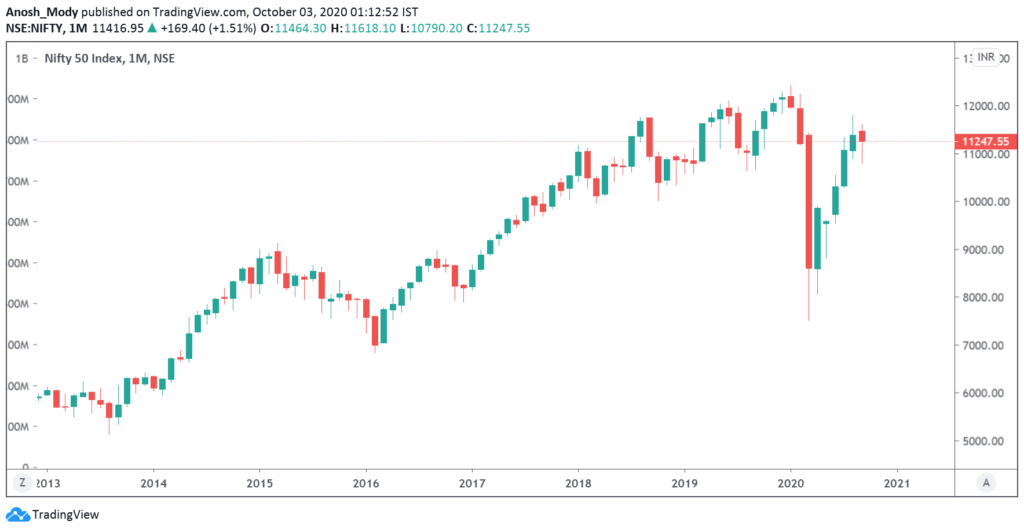
Here’s the monthly candle, which rejected lower levels and closed near last month’s close.
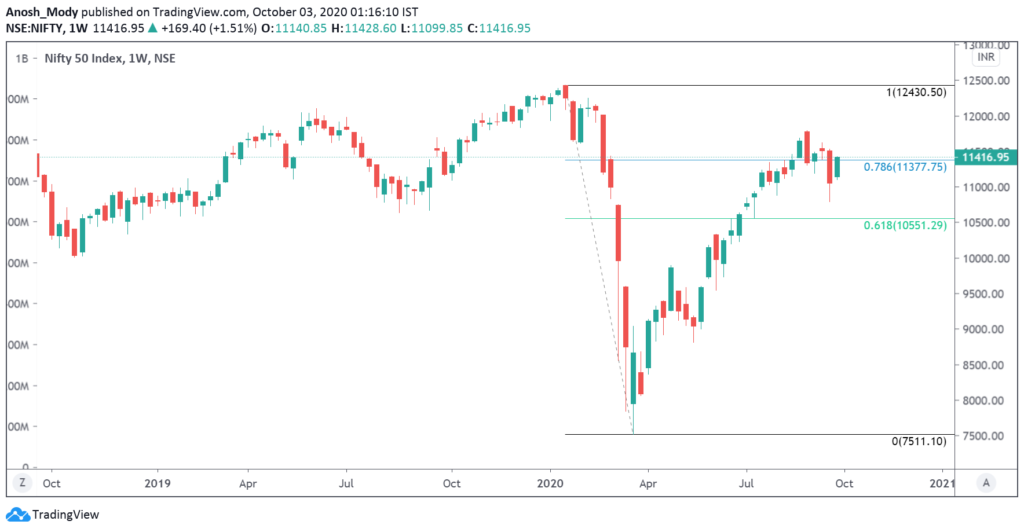
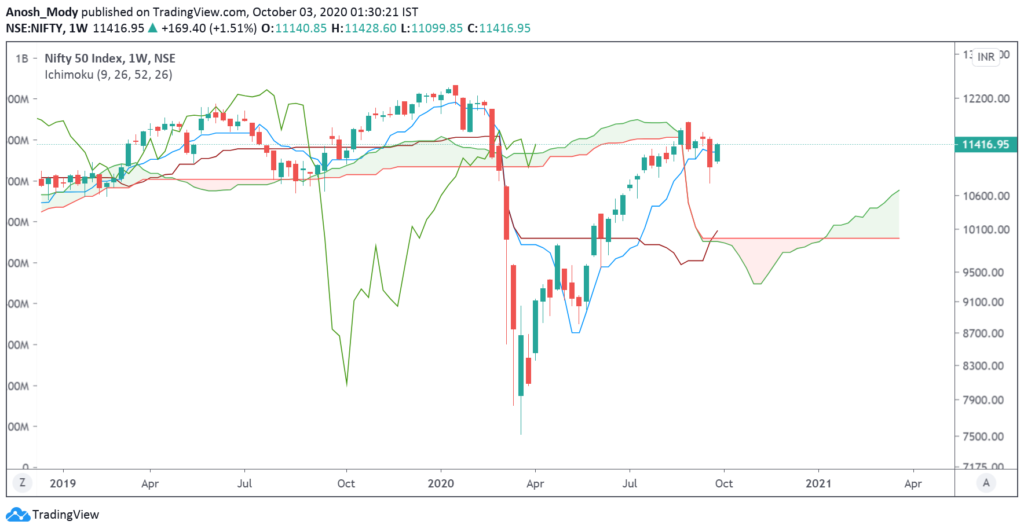
The weekly candle formed a bullish harami pattern, and a follow up above this week’s high will activate the move to the upside.
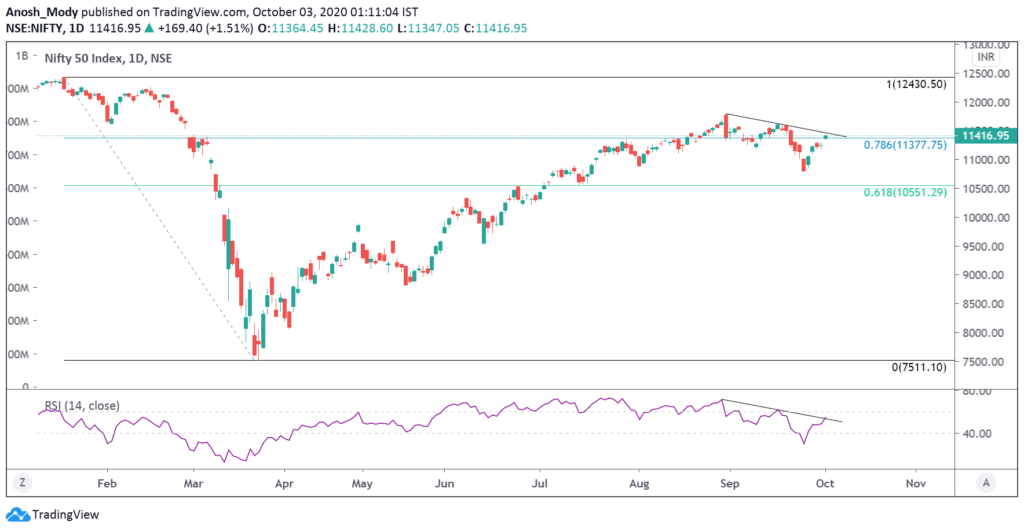
On the daily chart, we see the index placed at a downward sloping trendline on both price and RSI which can act as resistance.
Please read on to understand our rationale. This article contains an analysis of technical parameters as well as open interest and derivatives data. All the information below has hints for what levels to watch out for in weekly trade. Replicating these on your charting software and keeping an eye on them can help minimize unpleasant shocks in your trading.
Moving Averages
A quick snapshot of how the major Moving Averages are placed on the daily chart. Nifty managed to move above 20 & 50 DMA on Thursday.

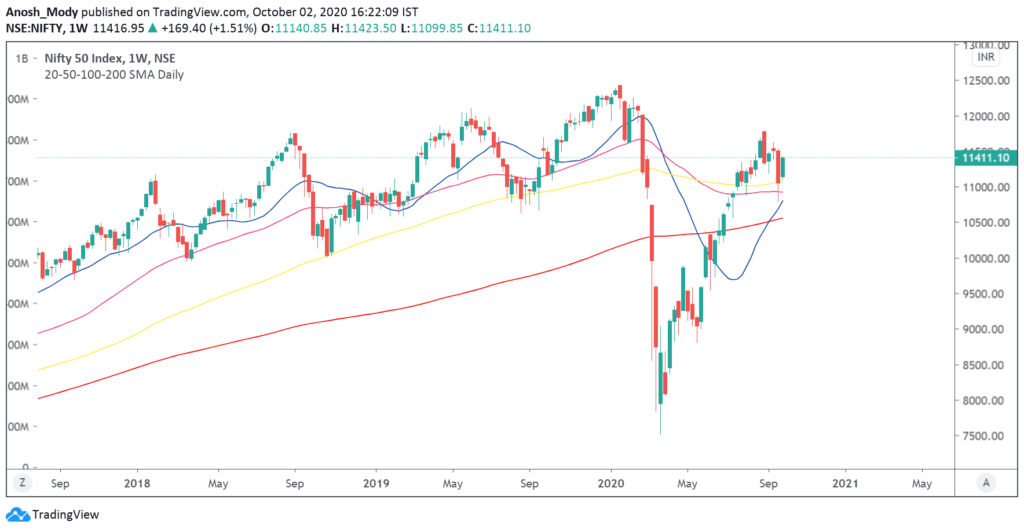
A quick snapshot of how the major Moving Averages are placed on the weekly chart.
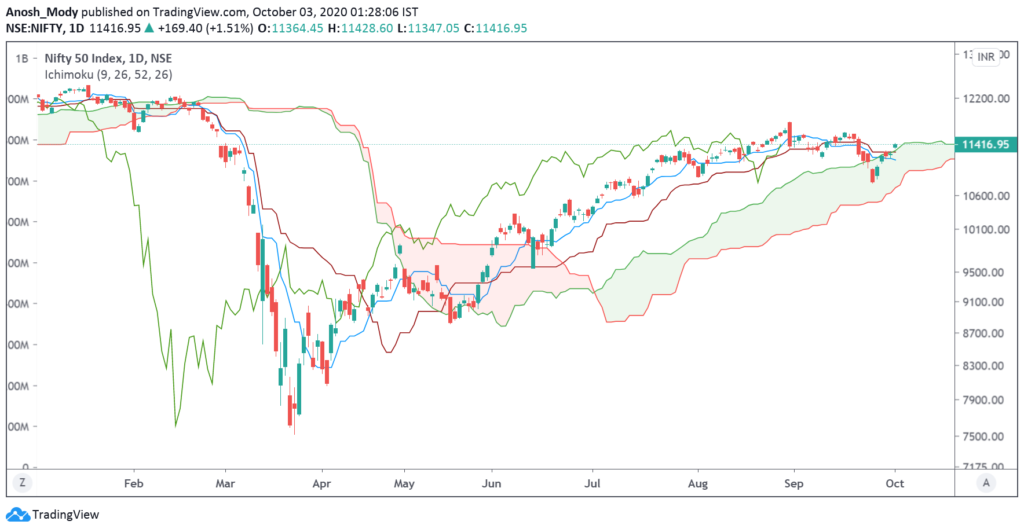
Ichimoku (D)
Index moved above the cloud on Thursday, after struggling a little at the Kijun Sen.
Ichimoku (W)
Nifty Intraday
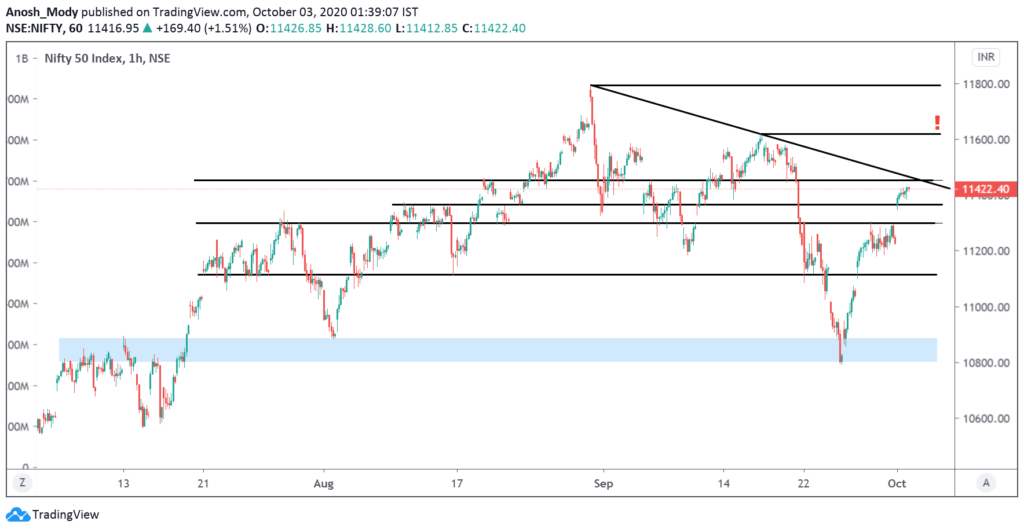
Critical levels marked on the chart. In case of a breakout from the downward trendline, do be cautious in the 11600-660 range.
Bank Nifty
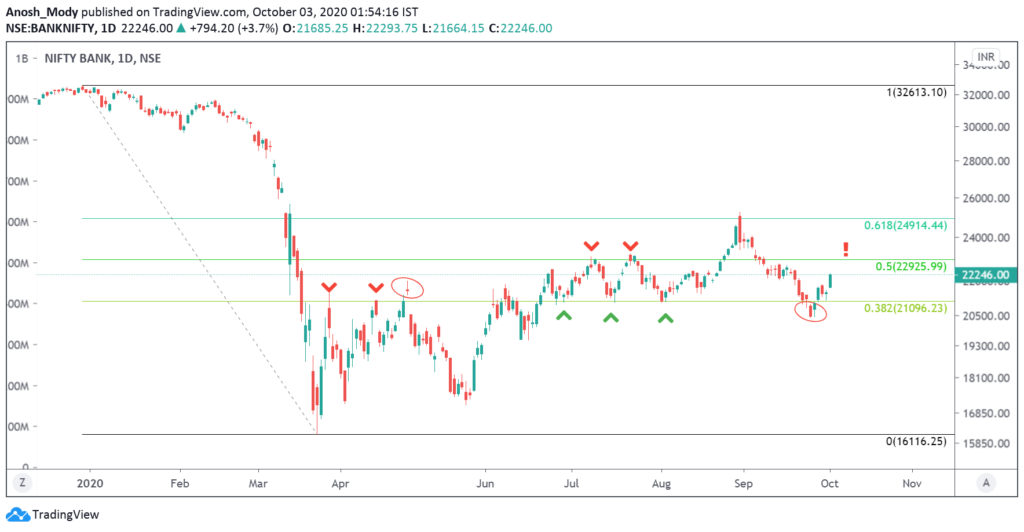
Bank Nifty performed quite well this week after finding support near the 21100 levels, staging a fake breakdown. Be cautious around 22950-23200, as the index has taken resistance twice there before.
Bank Nifty / Nifty (Relative Chart)
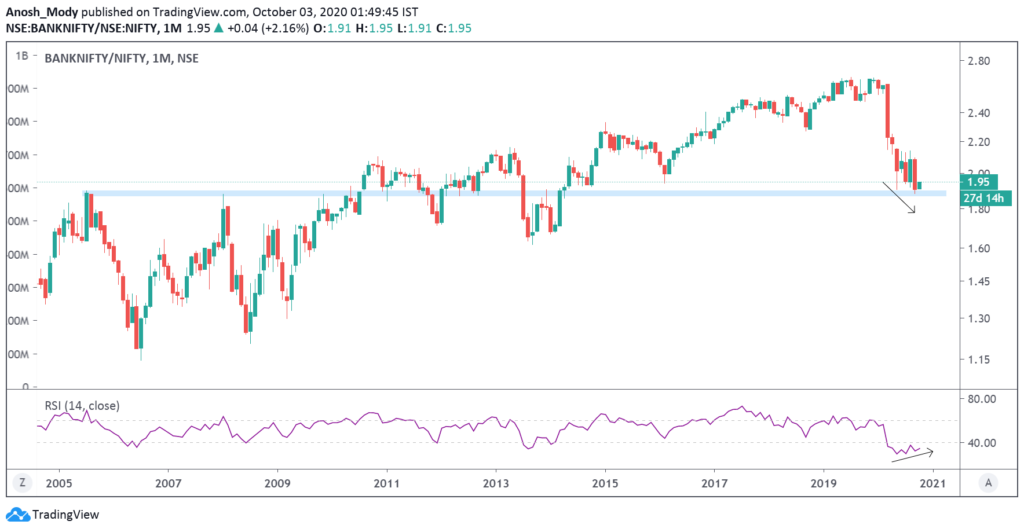
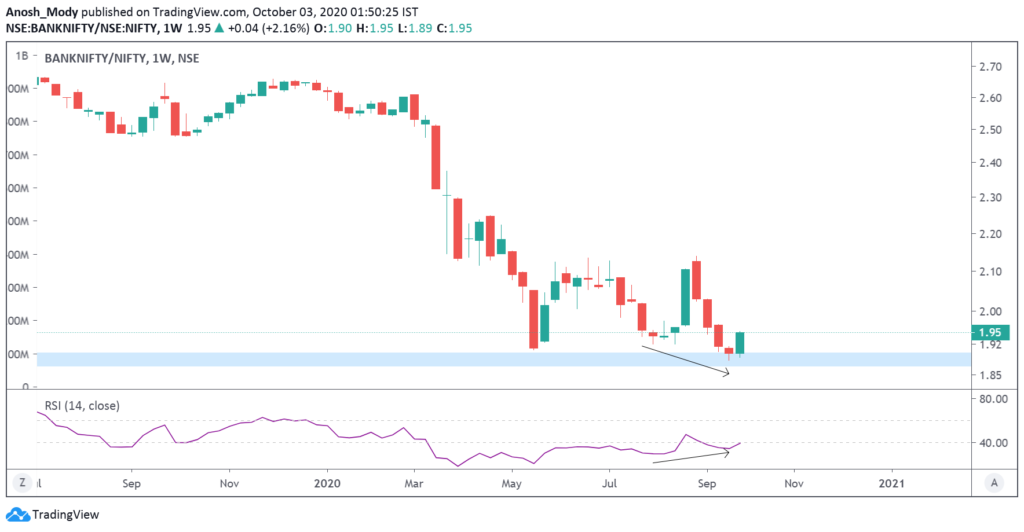
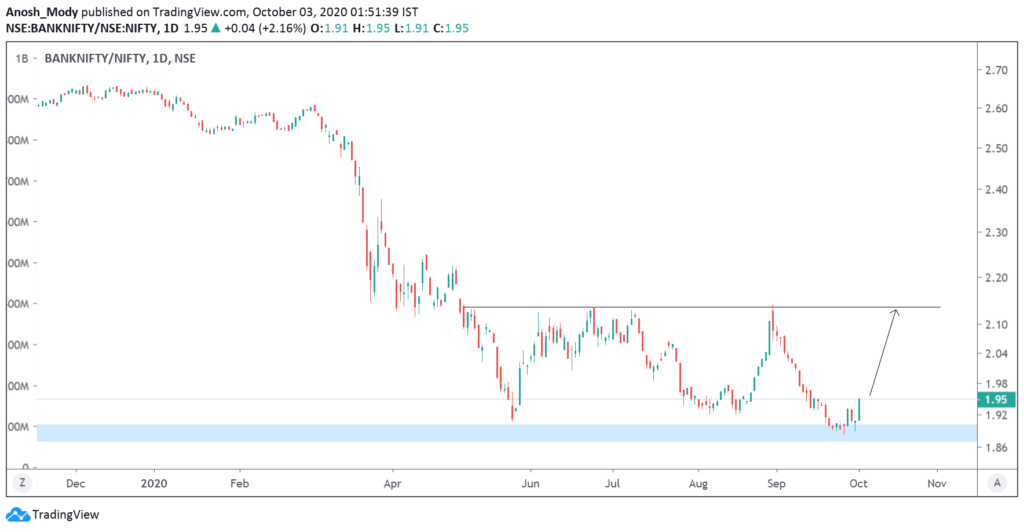
This pair is witnessing an up move from the support zone, after a bullish RSI divergence on the monthly and weekly charts. Bank Nifty can outperform from here.
Nifty SmallCap 100
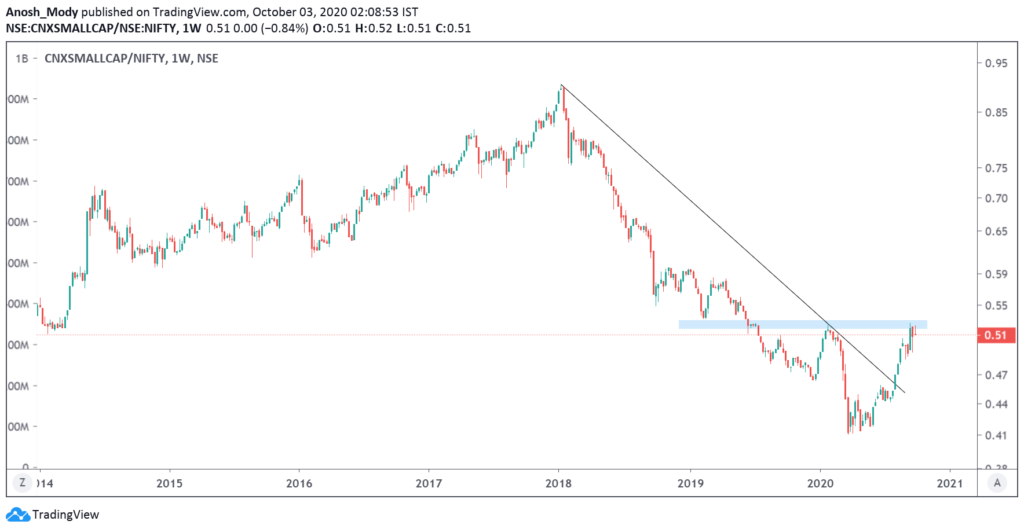
The index is right at the confluence of major horizontal and diagonal trendline resistance. A breakout above this level will set the stage for the next leg up
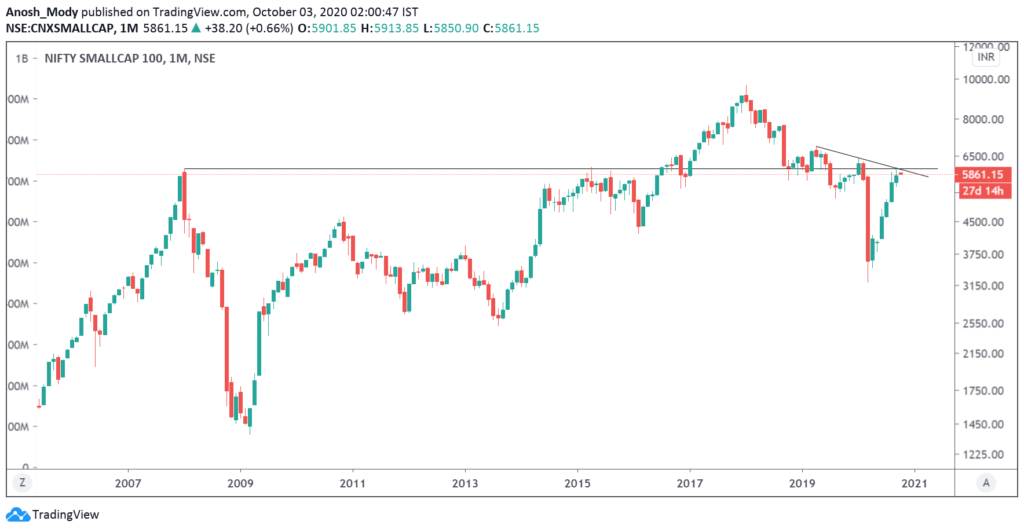
The relative chart is at a critical resistance level and a decisive move above 0.52 can lead to smallcaps significantly outperforming.
Nifty Midcap 100
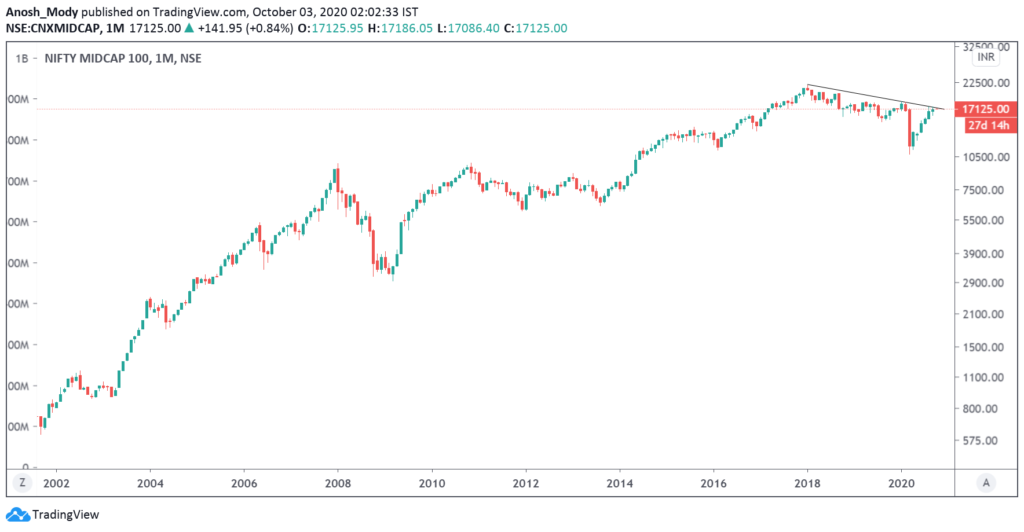
The index is at a major downward trendline resistance. Breakout from this can bring good upside.
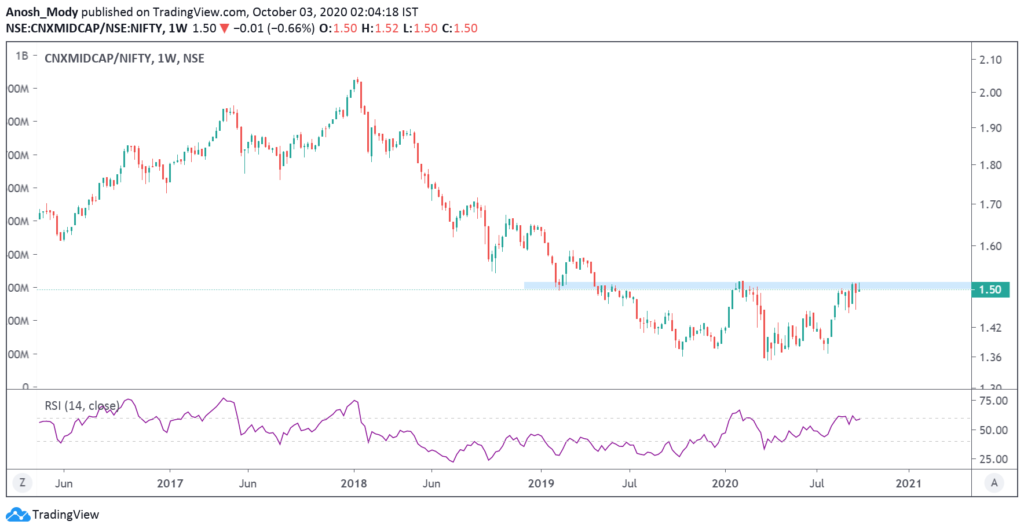
The relative chart is at a resistance level and midcaps can significantly outperform above 1.51
Currency
DXY
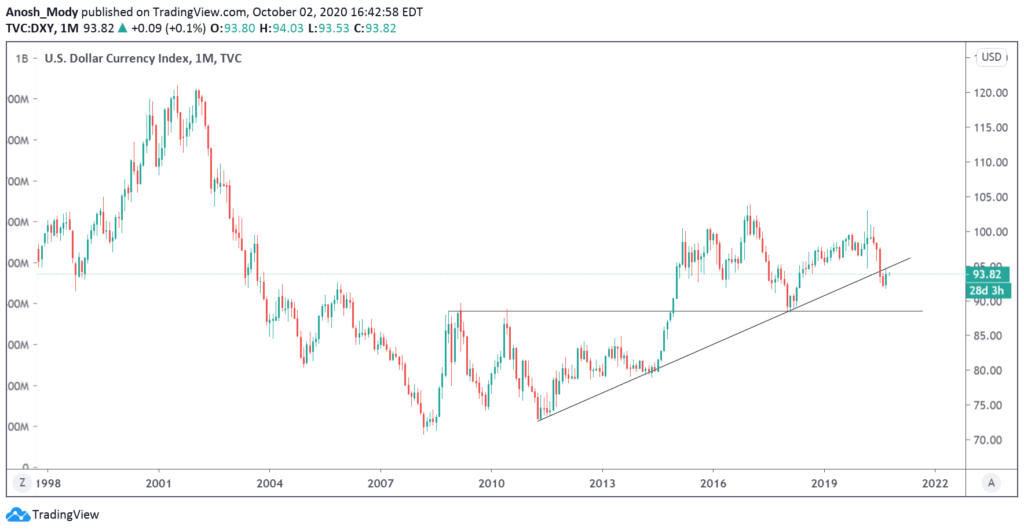
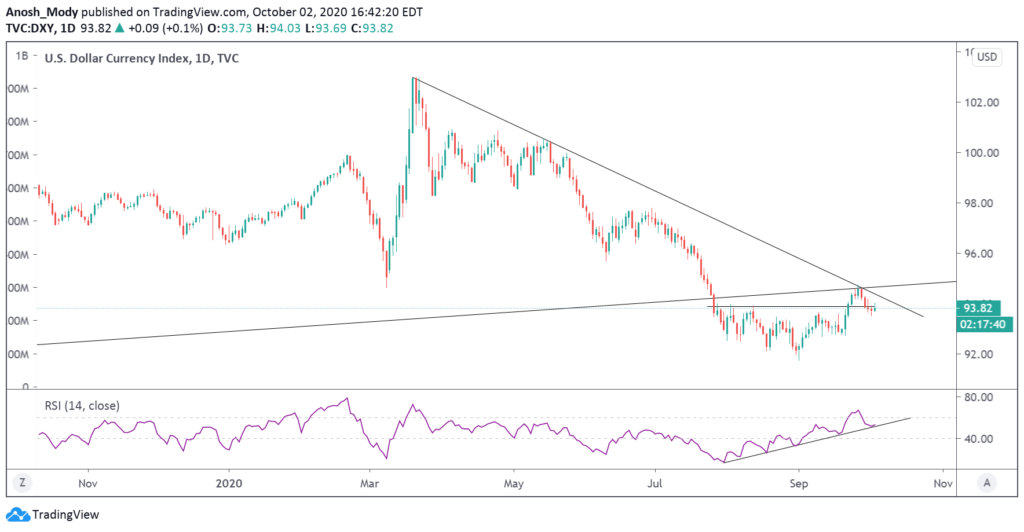
The dollar index seems to be rejecting the retest of the downward trendline and is moving lower. A decisive move below 93.6 and a breach of the daily RSI trendline will increase conviction for this move.
USDINR
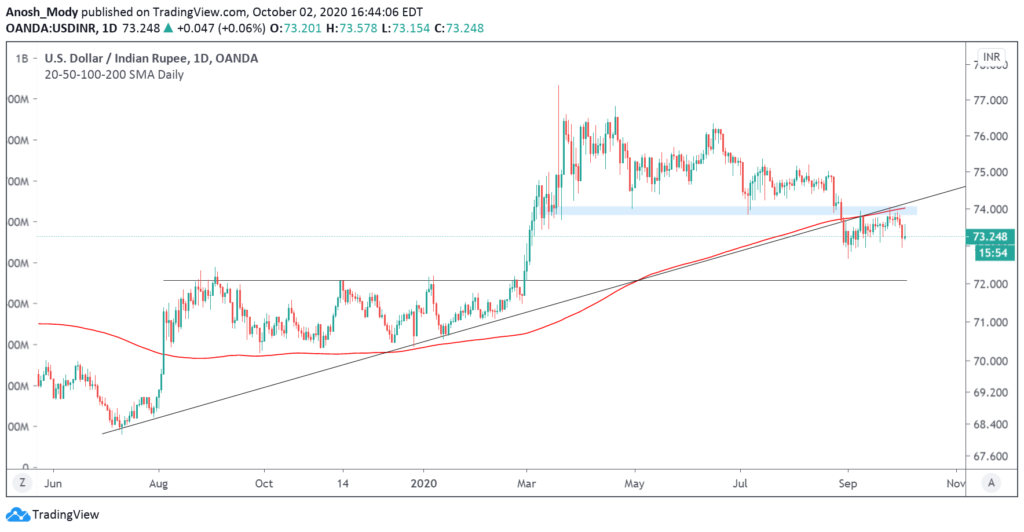
Moving lower from the breakdown retest.
OI Analysis:
Open interest or OI is the total number of open positions in the market. A high OI indicates that there is a lot of activity in that instrument. It does not indicate buyers and sellers individually but is instead a more holistic measure, i.e. it is the number of contracts between the buyers and sellers, not the buyers and sellers on their own. One of the ways OI analysis works is that high-volume market participants would have sold strangles at strikes which leads to higher OI. This type of reading does not typically account for other types of spreads that one may trade, but the data for it is available.
Nifty
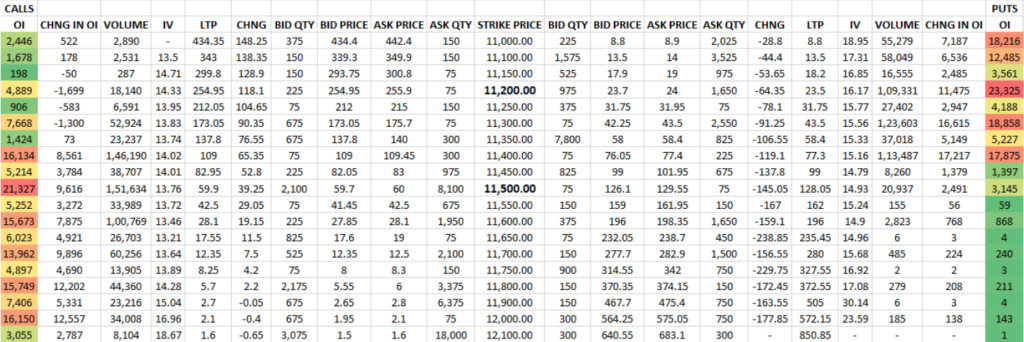
At 300 points, this week’s range really isn’t that high. We have seen a range of upto 500pts in the past. The premiums of these options seems sufficiently high to be lucrative for writing. This could could mean that we may either see Nifty stay within the range or we may be seeing a bull call type strategy being entered into by larger participants. If it’s the former, we could expect stiff resistance on Monday. This ties in with President Trump testing positive for COVID-19. While the event isn’t material for the Indian financial markets, sentimentally speaking, some parties may be bearish due to the US dip.
Bank Nifty
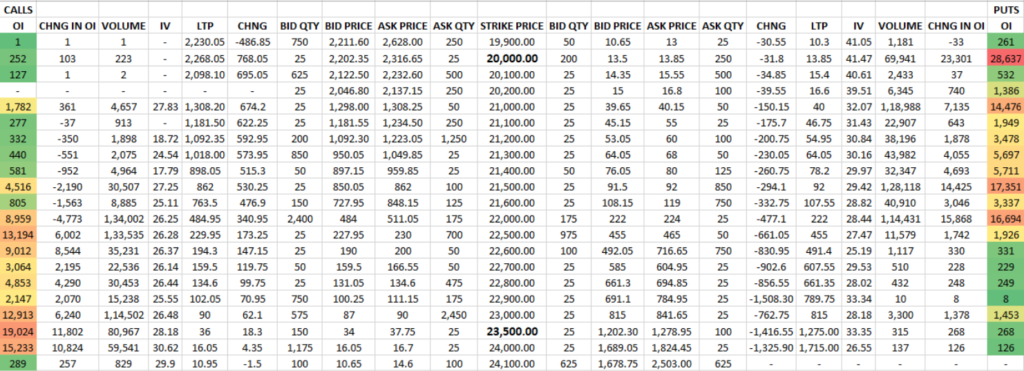
Nifty’s range was quite narrow, but Banknifty’s is quite high. This could be due to the moratorium hearing on interest on interest. Since it has been waived off for amounts up to 2 crore, it would have a material impact on banking stocks.
Smart money might have expected a large move, hence this could have been an attempt to cash in on that. If this hypothesis is true, we could expect a drastic change in OI structure when the week opens.
Heavyweights in the Nifty 50:
Let’s look at some important stocks in Nifty50 that collectively make up around 44.02% of NSE’s flagship broad market index. The analysis is done on both, Daily and Weekly timeframes. Charts displayed are either Daily or Weekly depending on which provides a clearer picture.
The weights used as per the most recent NSE press release available, dated September 30th 2020. As we had discussed last time, TCS has gained on ICICI Bank to break into the Top 5. RIL has performed quite well, too.
On the chart front, we’ve used naked charts for the most part to display the price action better.
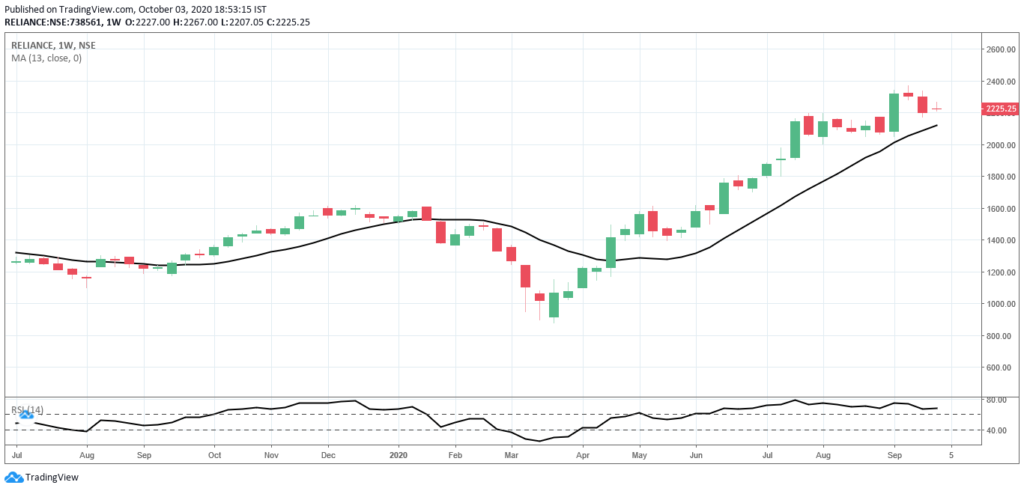
1. Reliance (14.90% weight): The big beast slipped a fair bit and has been facing tremendous resistance at levels above 2240. This isn’t a good sign. But with two major investment deals announced before the weekend ended, we could expect the stock to move up if investor sentiment is positive. The chart we see below is the Weekly timeframe, used as it shows how the past week stacked up agains the previous ones better. It’s the first time since July that we’re seeing a doji being formed. The chart structure doesn’t look too bearish as it has made a higher low, but this coming week should decide if the bullish chart structure is held or not. (Read the Basics of Dow Theory and trend by clicking here).
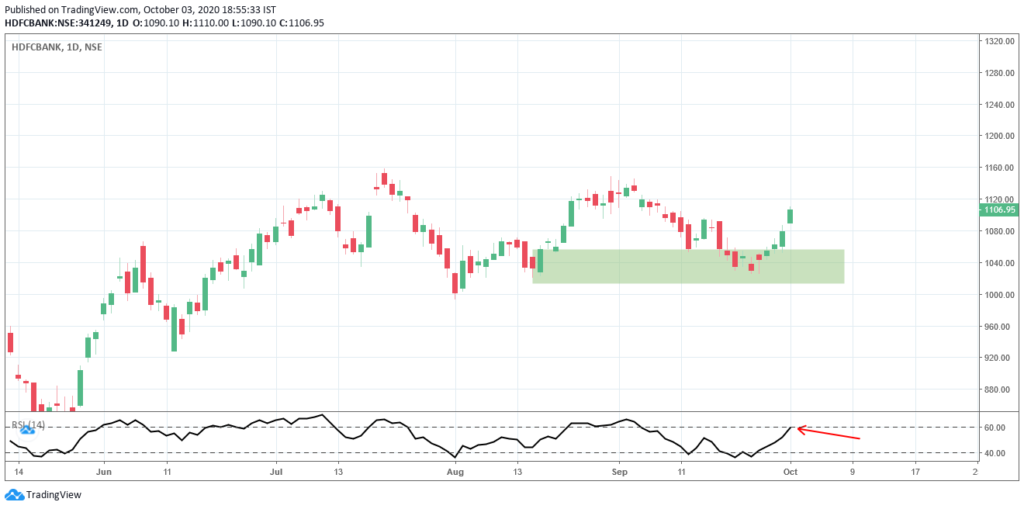
2. HDFCBANK (9.67% weight): HDFC Bank was the only banking stock on several days that held the index together. This is reflected on the charts as well, with the bank gaining tremendously from a support zone we had discussed earlier. So much so, it has even breached past a CIP resistance with ease. Personally speaking, we do not feel it’s a good time to be bullish on the stock (for ultra short term trades) as a pullback could be likely. The risk-reward does not make financial sense at these levels. RSI 60 resistance is also seen, marked by the red arrow. That said, the stock isn’t bearish so as long as lower levels are held well, we could see healthy moves.
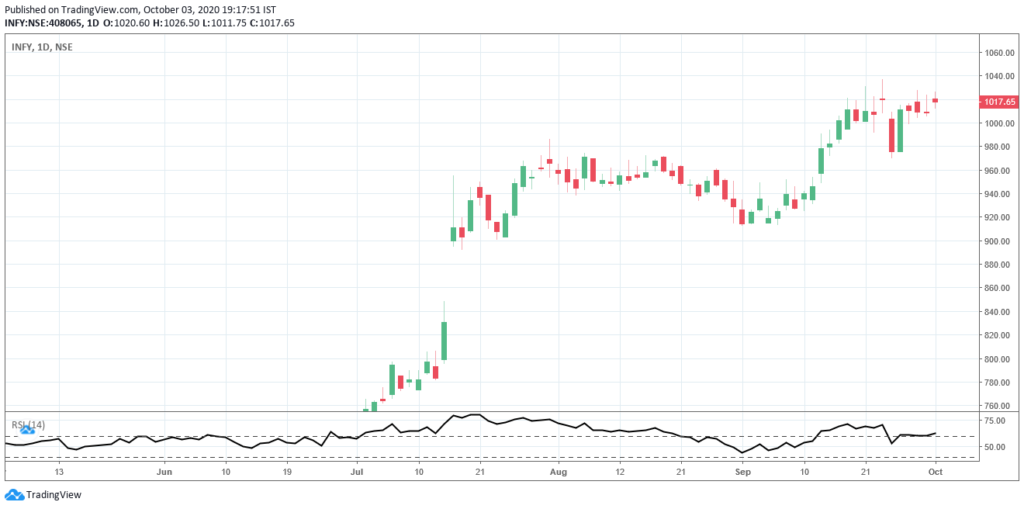
3. Infosys (7.62% weight): Even though IT has done well this past week, Infosys has shown some rather choppy price moves. Quite frankly, the kind of candles we see on the chart remind us of government energy companies or smallcaps, with large gaps and indecisiveness being apparent. Higher levels seem to be rejected, so as long as the 1000 mark is held, we could expect healthy moves. If IT as an industry is strong, we could expect a retest followed by an upmove. Overall, Infosys looks pretty decent.
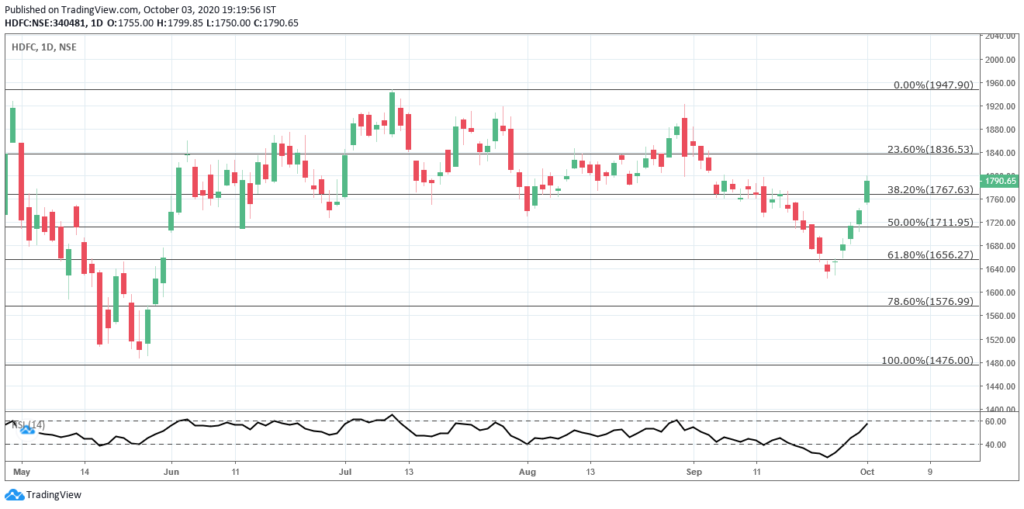
4. HDFC (6.43% weight): HDFC’s chart looks very similar to HDFC Bank’s. It’s managed to breach quite a few resistances, but is around a consolidation zone which it must breach. We could expect the FIB levels to act as supports if a pullback is seen and if the bullish chart structure is continued. One thing to add is that HDFC and HDFC Bank’s upmoves are very similar to how Nifty gains in uptrends – with large positive candles and gaps. Quite interesting.
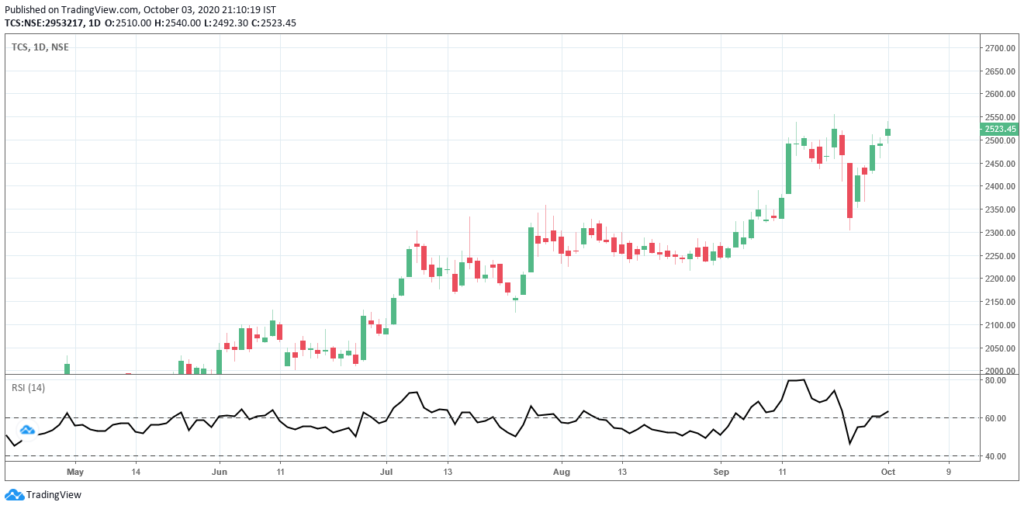
5. TCS (5.40%): TCS has fared much better than Infosys. We saw some neat moves by TCS this week, with lower levels being rejected. Intraday speculation opportunities were aplenty thanks to this. Even though the stock has cleared 2500, it does face resistance around these levels. Moreover, while it is around a prev high, RSI is considerably lower. This means that the stock has a lot more leeway, speaking in terms of momentum.
Heavyweights in Banknifty:
Since we have started analysing Banknifty in Market Chronicles, we decided to include some top movers of Banknifty. The number one mover is HDFC Bank, which has already been spoken about in the previous section, so we will discuss two other important stocks here, namely Kotak Bank and SBI. Other banks have an impact on the index, but these along with ICICI Bank are typically the movers.
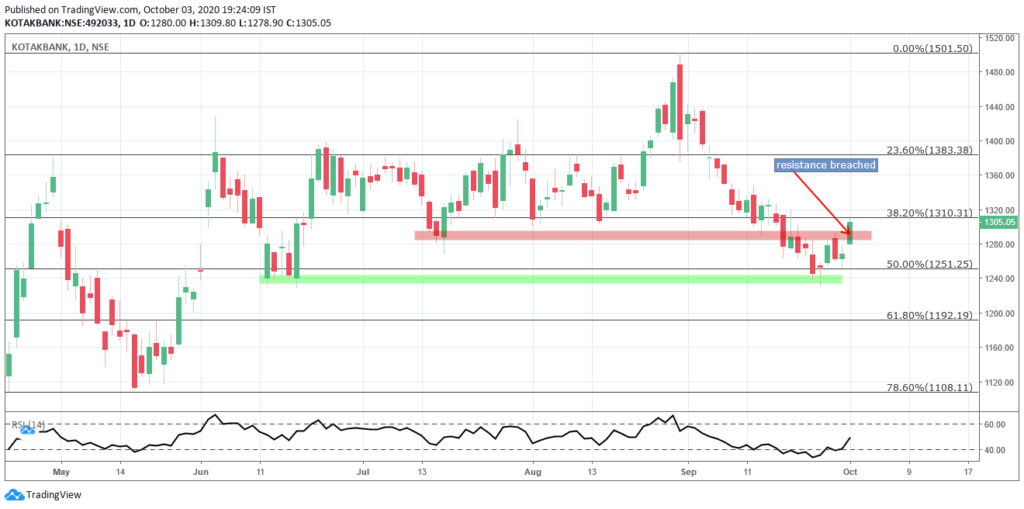
1. Kotak Bank: Not as linear as HDFC Bank, but the stock has risen fairly well this week, right from a support zone. It has breached a resistance zone, as seen in the chart, but expect resistance until it decisively clears 1310-1320 as this could potentially be a bull trap as well. Overall, doesn’t lok bad. Major resistances expected around 1380.
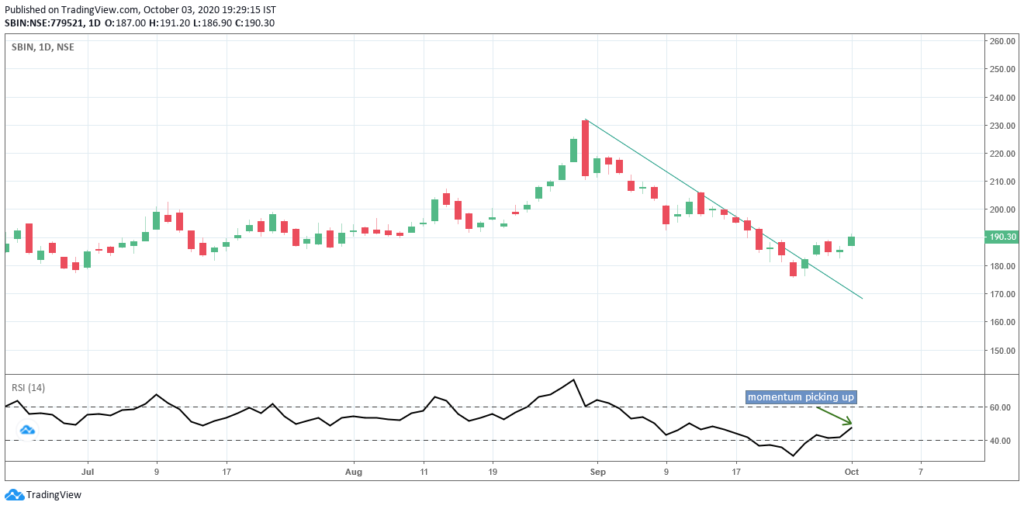
2. SBIN: After the downtrend line being drawn, SBI Bank managed to breach it, but only just so. We did not really witness an explosive breakout, but as long as ~190 levels are held, we could expect the stock to do fine in the coming week.
Volatility:
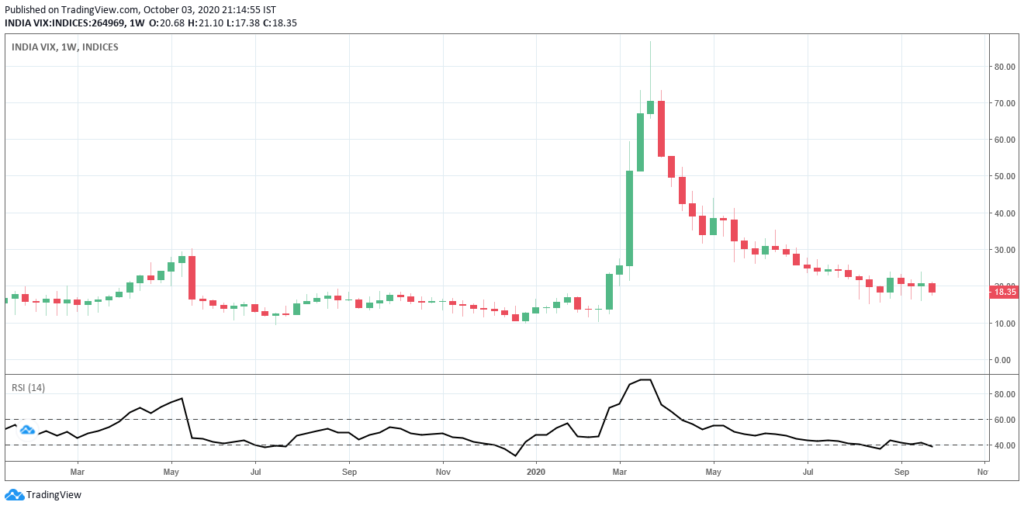
VIX continues to fall, but based on intraday price movements and overall sentiments, we believe that the actual price movements are not very well described by INDIA VIX this time around. If the markets continue climbing a wall of worry, we may continue seeing lower VIX levels, until it doesn’t. When VIX may just spike.
VIX was quite laggardly the past few weeks, but it has broken the 20 mark on a weekly closing basis which is improtant. It continues to plataeu out though…
For your reference, a lower VIX (or lower volatility) is generally associated with price moves that are less choppier and more trending. It also results in lower option prices (due to a lower IV). But at the same time, the ATR (Average True Range) of the stock would be narrower.
Disclaimer:
We, Anosh Mody & Krunal Rindani shall take no responsibility for any losses occurring out of investment/trading decisions you make based on the contents of this article.
We are not SEBI registered investment advisors. This article is meant for educational purposes only, please consult your investment advisor before acting upon any information you see here.
We may or may not have open positions, kindly assume that we are biased.
Anosh Mody is an MBA student from SBM, NMIMS Mumbai. However, the views reflected in this article are strictly his own, and in no way reflect upon the B-School in any manner.
Follow Us @


