Market Chronicles for the week ended 4th September, 2020.
If you’re new to technical analysis and would like to know how to read the charts below, here’s a quick guide! https://www.investopedia.com/trading/candlestick-charting-what-is-it/
Nifty ended the week a worrisome 2.69% in the red, and formed one of the most formidable trend reversal candles on the weekly chart: A bearish engulfing candle. A follow-up below this week’s low would be an open invitation for the bears to drag the index lower.
Our outlook is now HIGHLY CAUTIOUS. Below last week’s low, we could be in for a longer correction, with immediate support at 11180-300, and 10860 being the last line of defence for the bulls, below which could be in for a long winter.
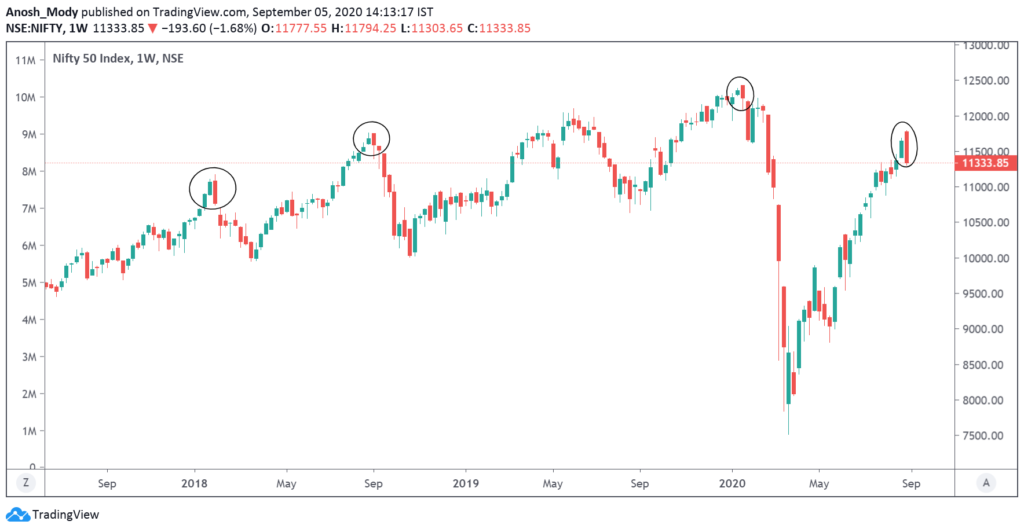
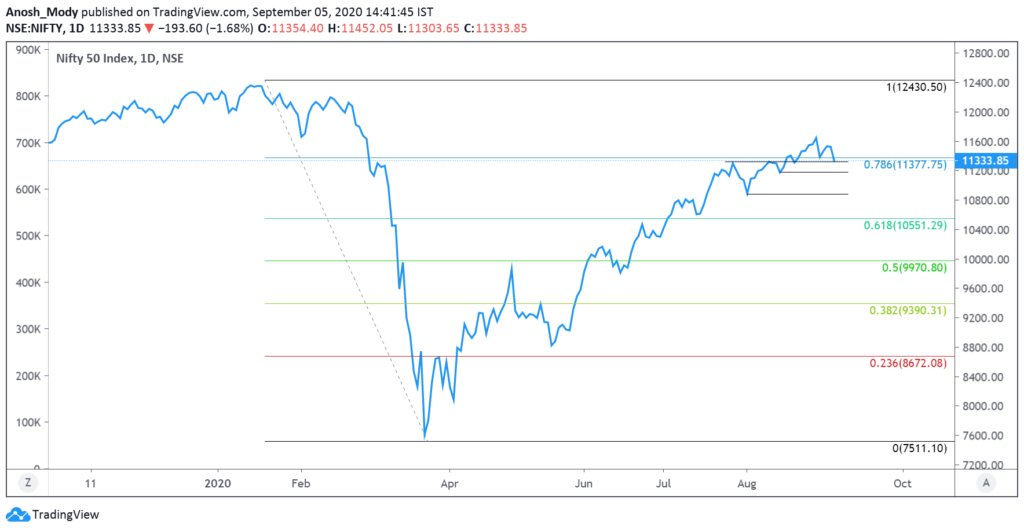
Please read on to understand our rationale. This article contains an analysis of technical parameters as well as open interest and derivatives data. All the information below has hints for what levels to watch out for in weekly trade. Replicating these on your charting software and keeping an eye on them can help minimize unpleasant shocks in your trading.
Trend
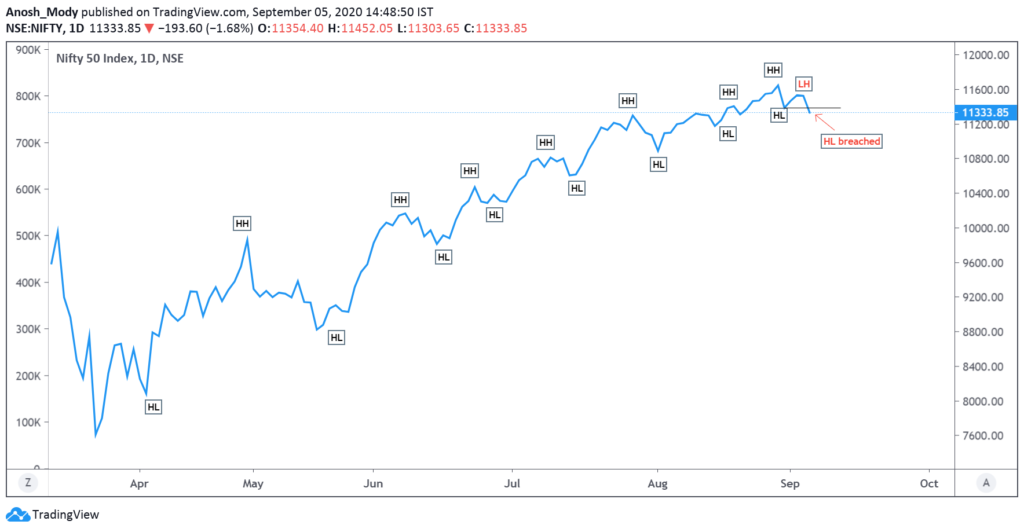
The uptrend is now under scrutiny, as this week formed a lower high, and breached the latest higher low. If the highs are not taken out soon, we could see a change of trend, from up to sideways/down.
Moving Averages
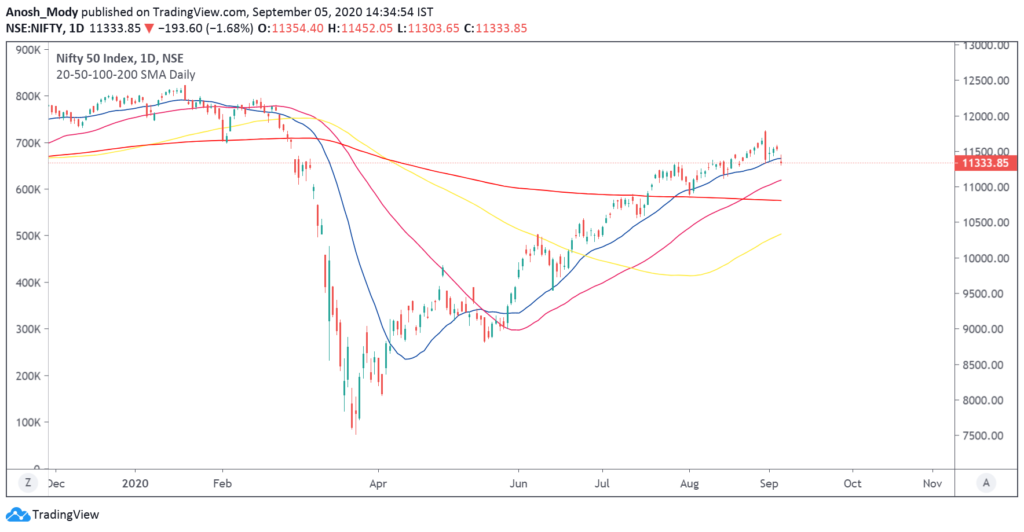
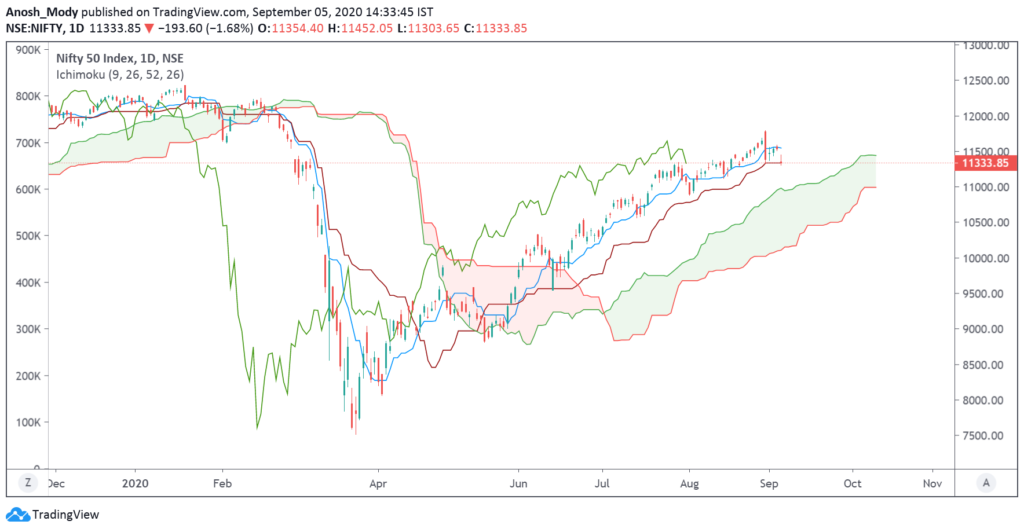
A quick snapshot of how the major Moving Averages are placed on the daily chart.
Ichimoku (D)
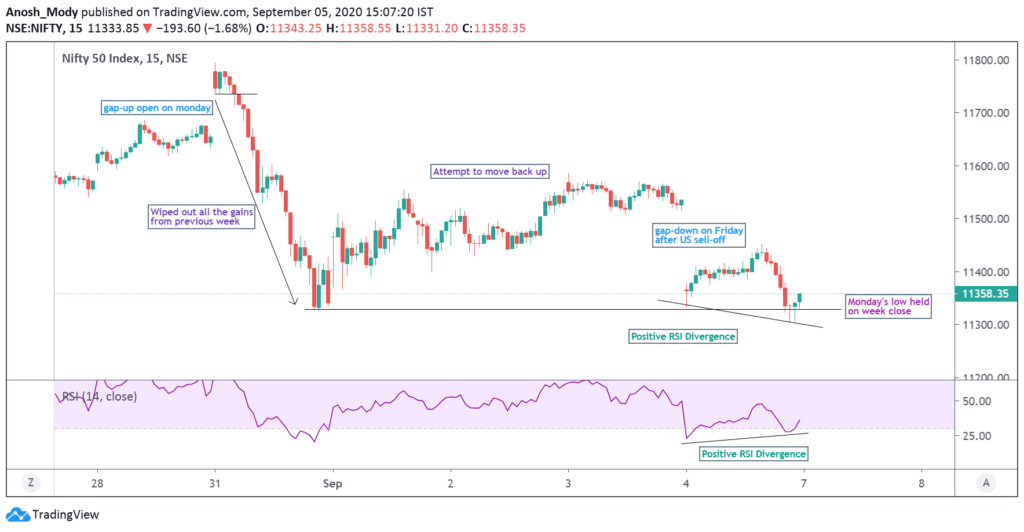
Nifty intraday
The week as a story
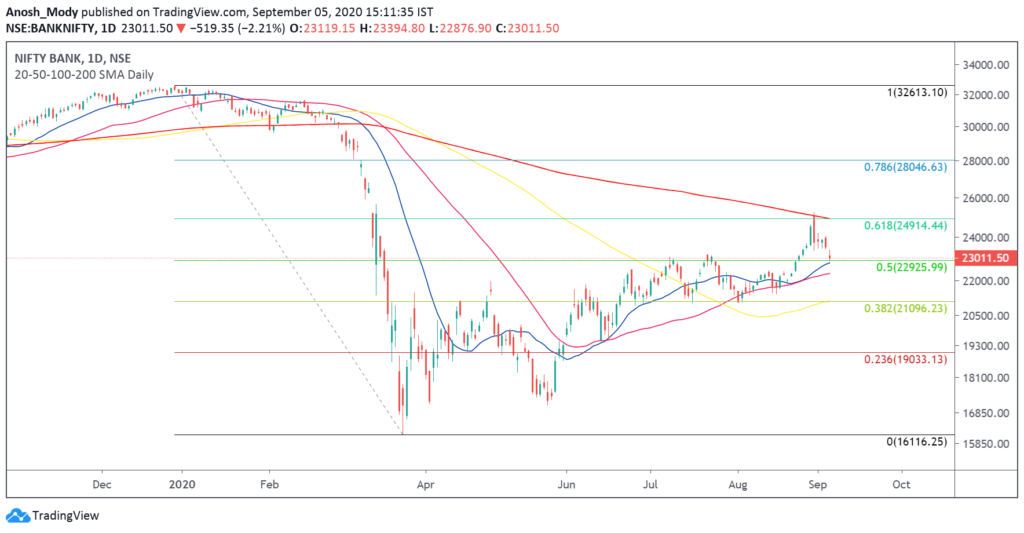
Bank Nifty
Bank Nifty could not face-off well against the 200DMA. It has now retested the breakout of 22925 which can act as a good area of support and we may witness a bounce here.
Bank Nifty / Nifty – Relative Chart
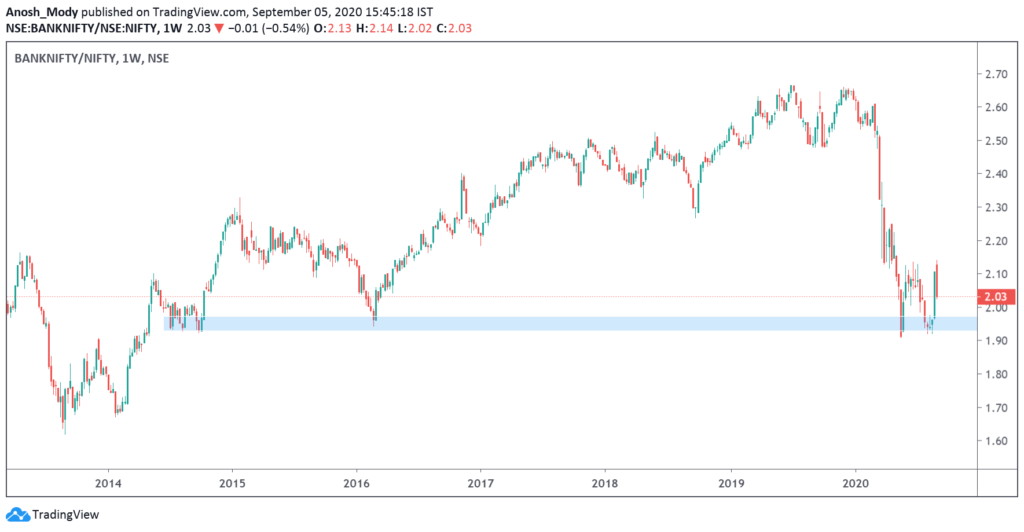
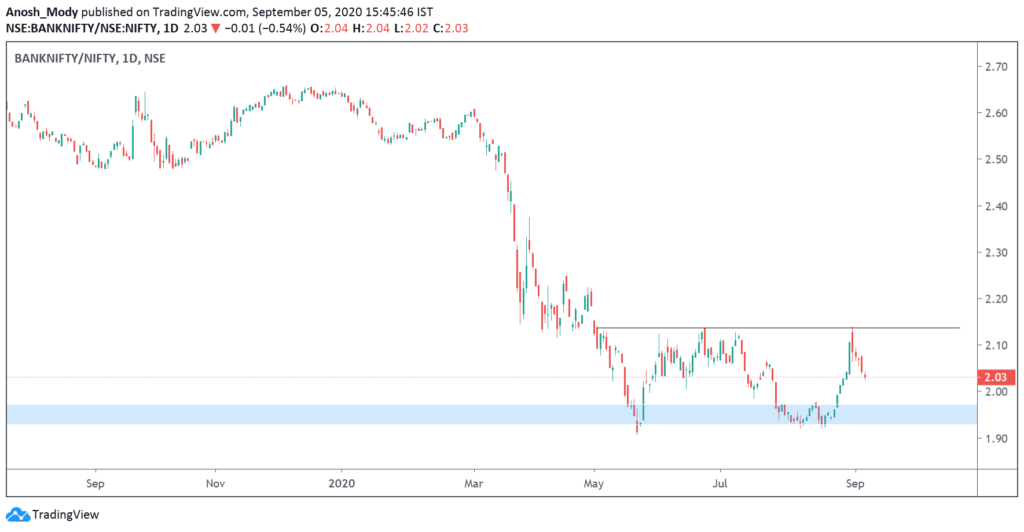
It appears as though we are headed back towards the support zone of 1.93 – 1.97. The pair might witness a bounce from there.
Next major round of outperformance for BNF only after 2.14 is taken out.
Currency
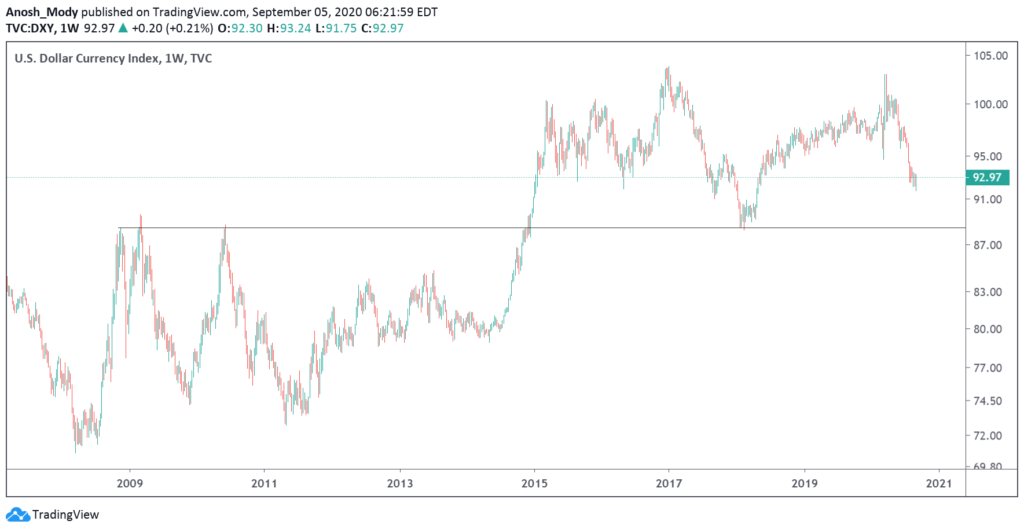
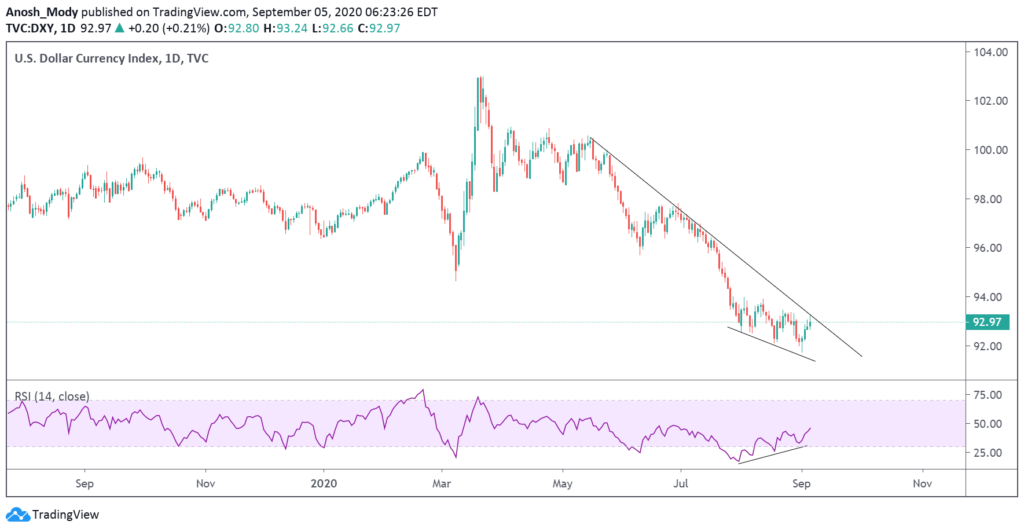
The US Dollar Index (DXY) continues to weaken, but is showing a sign of reversal on the daily timeframe, i.e. a positive momentum divergence. A breakout from the downward sloping trendline would confirm this trend reversal.
USDINR
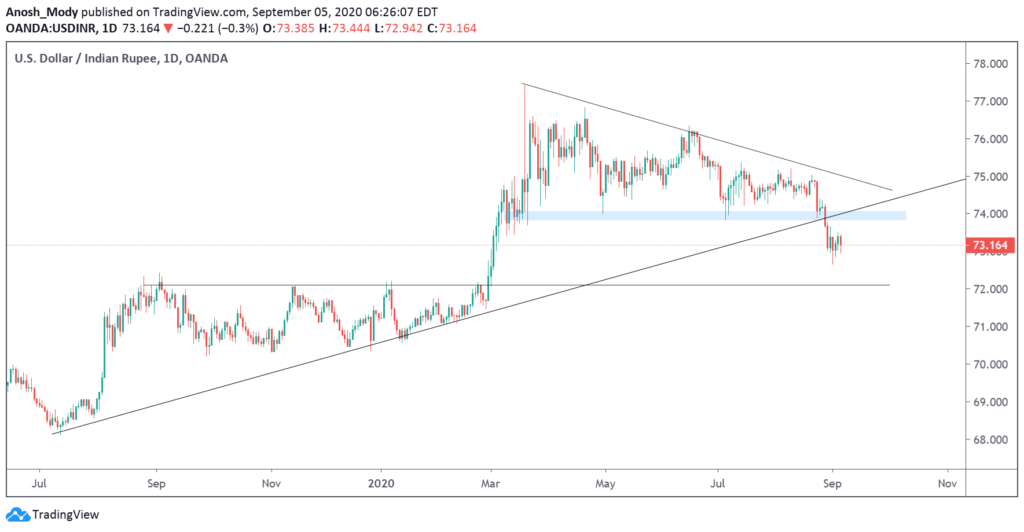
We might witness a retest of the breakdown of 73.8 – 74. Immediate support lies at ~72.1
OI Analysis:
Open interest or OI is the total number of open positions in the market. A high OI indicates that there is a lot of activity in that instrument. It does not indicate buyers and sellers individually but is instead a more holistic measure, i.e. it is the number of contracts between the buyers and sellers, not the buyers and sellers on their own. One of the ways OI analysis works is that high-volume market participants would have sold strangles at strikes which leads to higher OI. This type of reading does not typically account for other types of spreads that one may trade, but the data for it is available.
Nifty
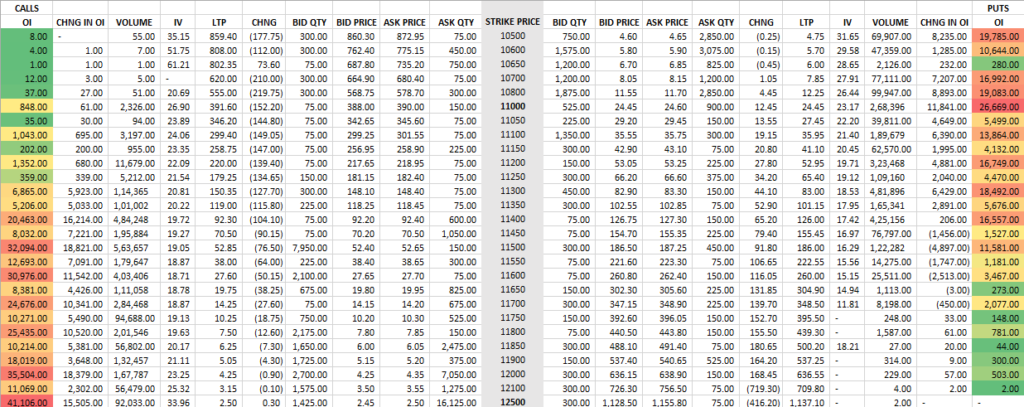
Looking at the OI figures of 10th Sep 2020 expiry, we can make two observations:
- The range has now inched higher to 12500.
- Lower limit is at 11000.
- This might potentially be due to the newer margin rules.
- Except for the lower strikes on the downside, nothing really indicates a bearish sentiment at first glance.
- This means that unless we see one-off events, Nifty should hold on to 11000+ levels this week.
While strikes closer to ITM will have a higher premium, they are also riskier. This could be why we are seeing more far OTM strikes having higher volumes. And this in turn could tell us that a larger move on either side cannot be ruled out.
Bank Nifty
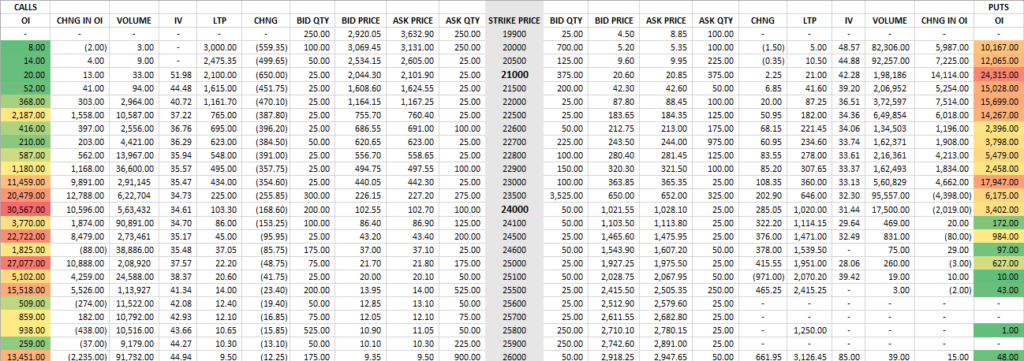
Not only is Banknifty’s range very wide at 3000 points, but except for a few high OI strikes, other strikes don’t seem to share a high open interest. This is quite odd as we typically see high OI on many Banknifty strikes. This could also be because of the high level of choppiness than Banknifty has experienced in the last week. While it outperformed the broadmarket while bullish, it has managed to severely underperform at times of selling pressure, too.
Heavyweights in the Nifty 50:
Let’s look at some important stocks in Nifty50 that collectively make up around 42.82% of NSE’s flagship broad market index. The analysis is done on both, Daily and Weekly timeframes. Charts displayed are either Daily or Weekly depending on which provides a clearer picture.
The weights used as per the most recent NSE press release available, dated August 31st 2020. New weightages should be with us next week onwards. Compared to the previous period’s, this month has seen some major changes including RIL’s weightage going down, HDFC Bank being almost at double digits, and ICICI Bank inching above TCS to reclaim its spot in the top five.
On the chart front, we’ve switched things up by using an EMA as it gives us a better idea of the trend. We’ve also used PSAR (Parabolic Stop and Reverse) which is another measure of trend; the black dot below price indicates uptrend, and a dot above indicates a downtrend. This has been done to better understand where the market is placed after a choppy past week. RSI has been used to understand momentum.
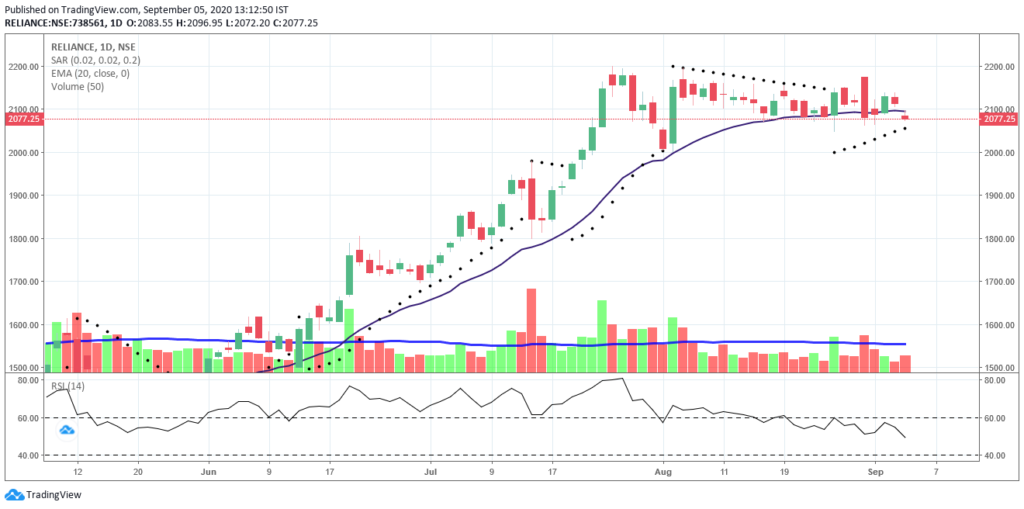
1. Reliance (13.63% weight): After a rather rough ast week for Reliance, we felt the price action was better understood via candle charts. Instead of a trendline , we used a 20EMA as this shows us a better idea of the shorter term trend, giving more weightage to the sideways movements RIL has experienced recently. Despite news of Silver Lake’s interest in $1bn worth of Reliance Retail stake, bulls were unable to really drive prices higher. Delivery percentages have also seen some serious dips and so has volume. These aren’t good signs at all, and to add to that, we can see how Reliance has closed below the 20EMA for the first time in awhile. Unless 2050-2075 is respected, we could see RIL testing support at lower levels. The RSI supports this as we can see how it has fallen and high-momentum levels. (Read the Basics of Dow Theory and trend by clicking here).
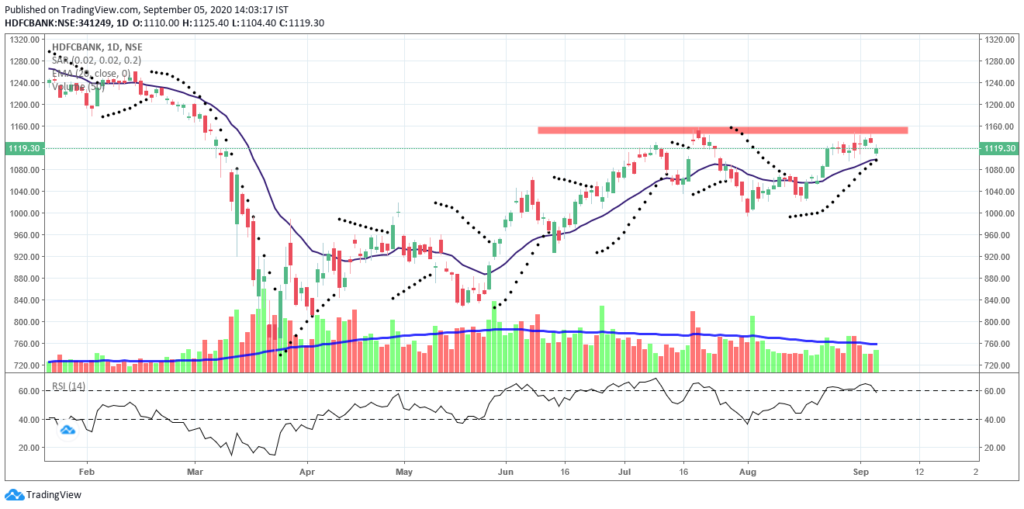
2. HDFCBANK (9.99% weight): We discussed how after a strong move last week, we could see 1120+ levels, where it currently rests. The red highlighted resistance zone should be an important one to breach, after which we could potentially see the stock heading towards pre-covid levels. Friday was a very rough day owing to a global selloff fueled by US-markets and SGX Nifty, which meant the Indian markets struggled quite a bit. HDFC Bank seems to have held up fairly well except for the gap down opening.
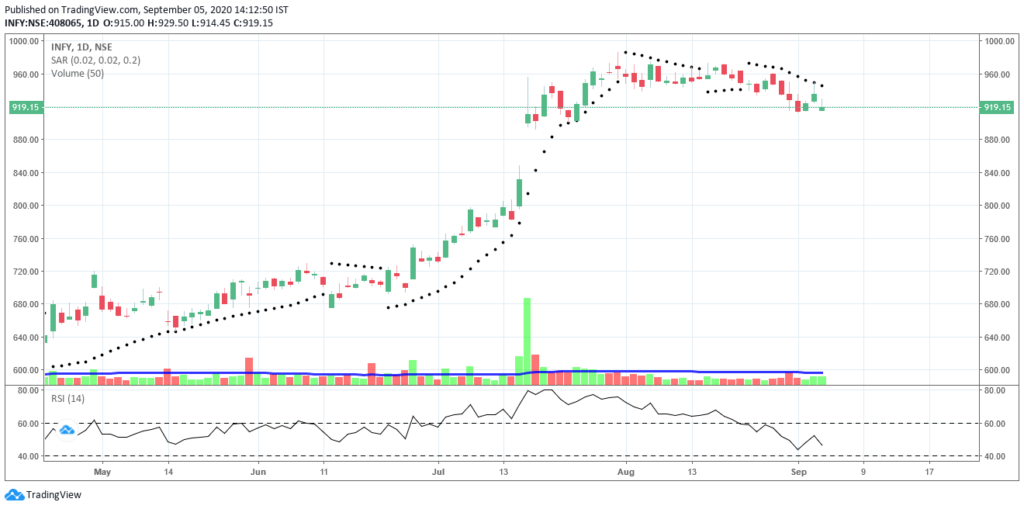
3. Infosys (7.03% weight): IT as a sector has been underperforming since the past couple of weeks. There appeared to be an attempt to change this sluggish trend, but volumes were unable to follow through. As long as 900 is held, there’s a chance we may see Infosys bouncing back up.
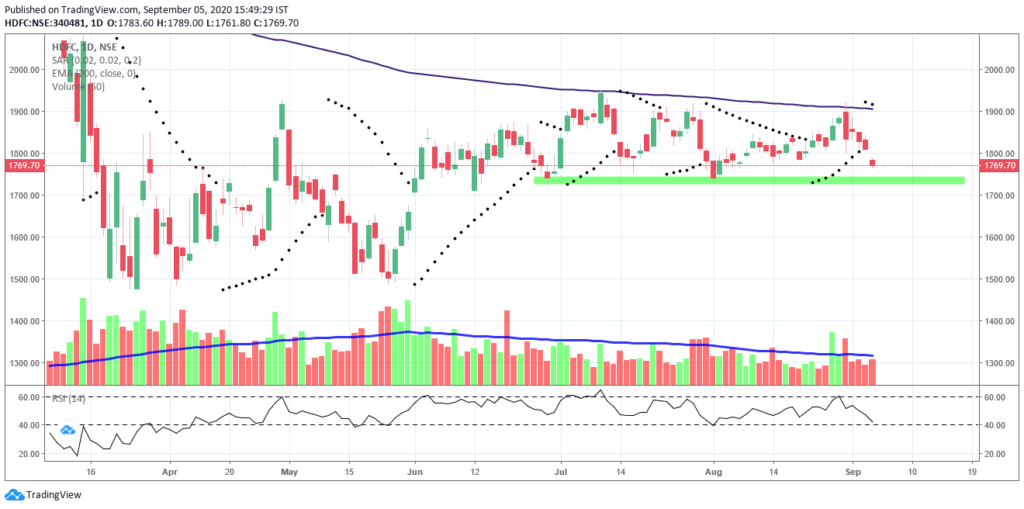
4. HDFC (6.55% weight): After facing resistance around the highlighted zone we had marked last week, HDFC is now approaching an important demand zone. The medium-term bullishness should continue as long as 1700 levels are held, below which sellers could potentially have the strength to drive prices a nudge below 1500. For a breakout, we must see a close above the 200EMA which has acted as a strong resistance so far. Volumes seem to be much stronger when compared to some other Nifty50 stocks which is a positive sign as it shows greater activity. And the demand zone might be seeing action as Friday saw a strong 51% delivery percentage.
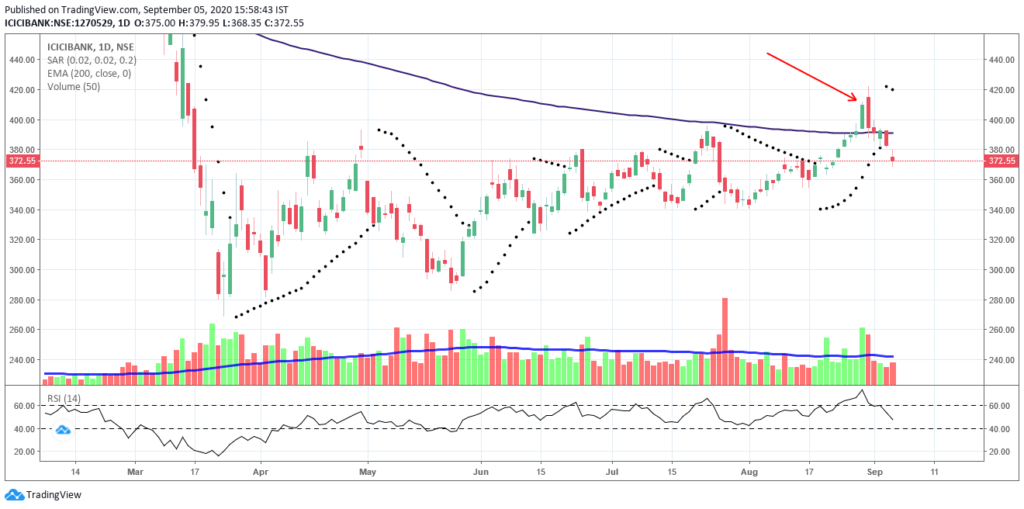
5. ICICI Bank (5.62%): ICICI Bank trapped novice traders quite well after the breakout close on Friday followed by a strong selling pressure on Monday. While Monday was a negative day for the markets in general, bearish engulfing on ICICI Bank isn’t a good sign and it would’ve possibly cleared a lot of the stoplosses that some traders might have set for the breakout trade. It looks quite weak compared to HDFC Bank, and experienced 20EMA resistance just like Nifty did. Unless the overall sentiment is positive in this coming week, ICICI Bank may underperform.
Heavyweights in Banknifty:
Since we have started analysing Banknifty in Market Chronicles, we decided to include some top movers of Banknifty. The number one mover is HDFC Bank, which has already been spoken about in the previous section, so we will discuss two other important stocks here, namely Kotak Bank and SBI. Other banks have an impact on the index, but these along with ICICI Bank are typically the movers.
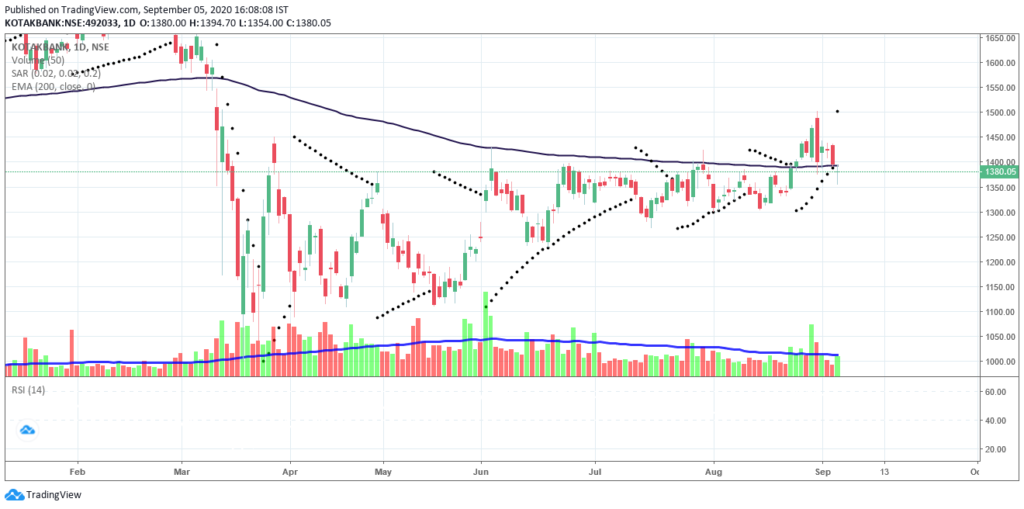
1. Kotak Bank: The stock has been quite volatile intraday with huge swings in either direction. Last week we spoke about how it could potentially be a strong pick, but now that it’s breached the 200EMA and has seen two consecutive upward PSAR dots, it might be preparing to test lower levels. One positive sign is that Friday’s candle was almost a dragonfly doji with high volumes which may indicate a recovery.
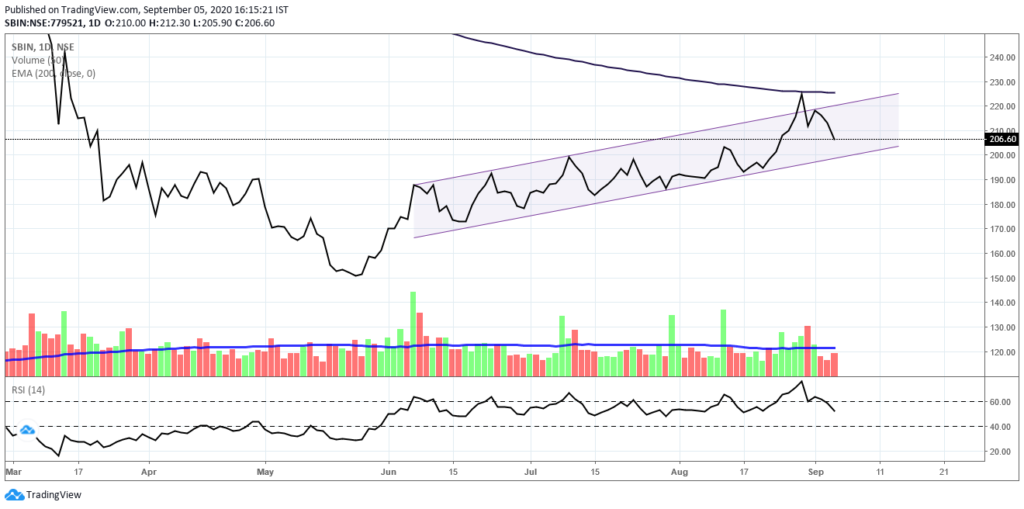
2. SBIN: After a strong breakout on Friday, Monday brought a sharp dip. We then saw SBIN retest the trendline, but volumes weren’t enough to drive prices higher and neither was momentum. As a result, we’re seeing some really clean price action, with resistance from 200EMA, channel resistance on the second breakout attempt, and now falling towards the trendline which is around the 200 psychological level. If that is respected, SBIN could continue making some strong moves.
Volatility:
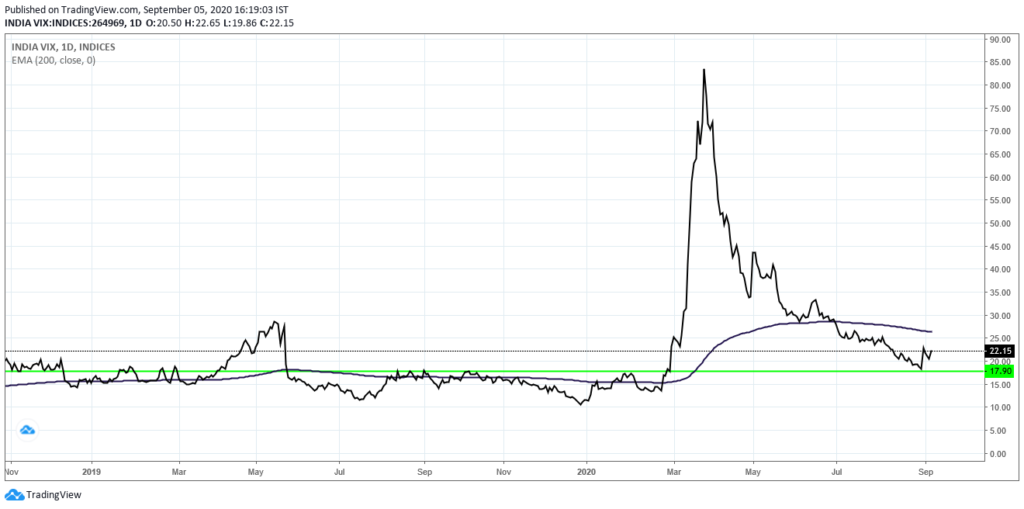
VIX continues to fall, but based on intraday price movements and overall sentiments, we believe that the actual price movements are not very well described by INDIA VIX this time around. If the markets continue climbing a wall of worry, we may continue seeing lower VIX levels, until it doesn’t. When VIX may just spike. In the previous edition, we used VIX to calculate the expected move this week, which had come out to +/- 2.60%. The actual movement was -2.69% which is quite close.
Because of the strong selling pressure and bearish bias the markets experienced, VIX cut short its losing spree and jumped double digits in a single day. This means that it’s back above 20 and intraday volatility does indicate that as well. So unless we see VIX returning to lower levels, we may continue to see some ambiguity and potentially large moves on either sides in this coming week as well.
For your reference, a lower VIX (or lower volatility) is generally associated with price moves that are less choppier and more trending. It also results in lower option prices (due to a lower IV). But at the same time, the ATR (Average True Range) of the stock would be narrower.
Disclaimer:
We, Anosh Mody & Krunal Rindani shall take no responsibility for any losses occurring out of investment/trading decisions you make based on the contents of this article.
We are not SEBI registered investment advisors. This article is meant for educational purposes only, please consult your investment advisor before acting upon any information you see here.
We may or may not have open positions, kindly assume that we are biased.
Anosh Mody is an MBA student from SBM, NMIMS Mumbai. However, the views reflected in this article are strictly his own, and in no way reflect upon the B-School in any manner.
Follow Us @
Some Unrelated Stories!


