Market Chronicles for the week ended 21st August, 2020.
Nifty ended the week a healthy 1.7% in the green.
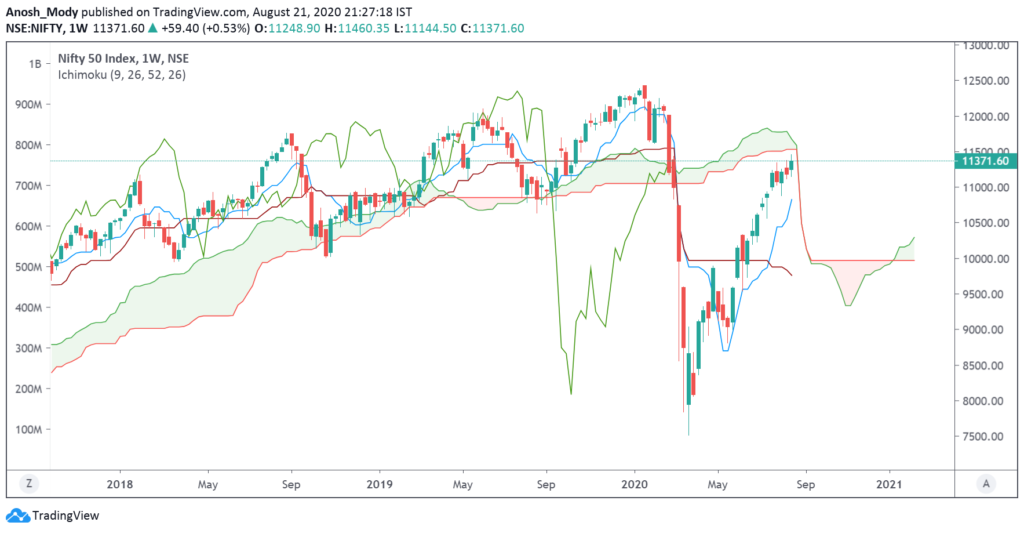
The resistance zone at 11377 is proving to be quite tough to breach. Our outlook is CAUTIOUSLY BULLISH till this level is taken out.
To the upside, the last major gap from March still remains unfilled between 11377-11630.
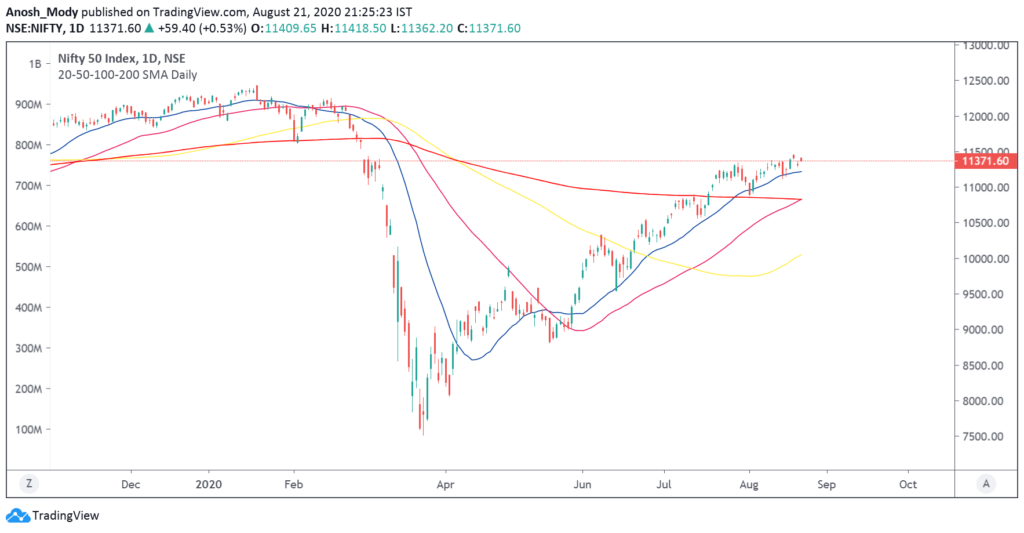
We are at the brink of the golden crossover, i.e. 50 DMA crossing over 200 DMA.
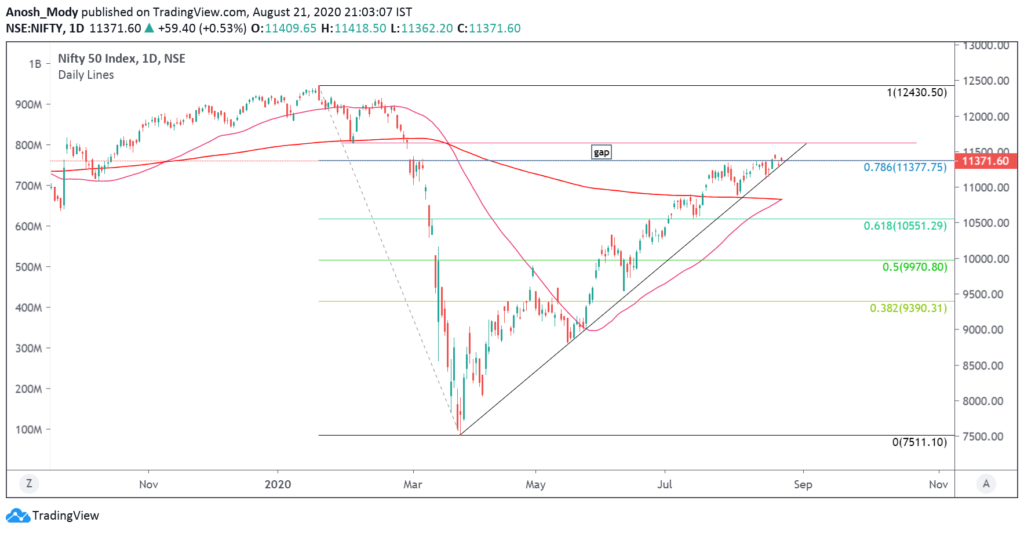
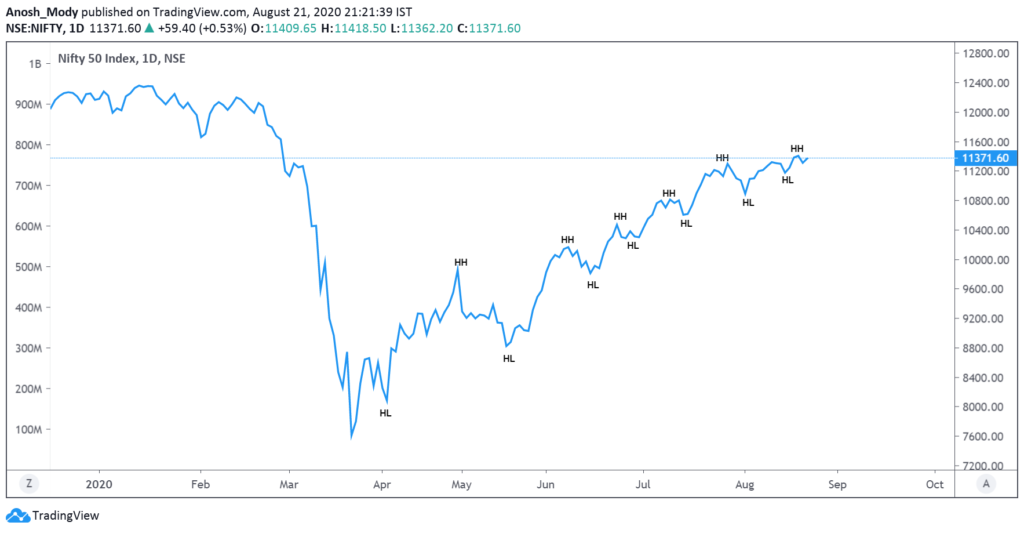
Uptrend is firmly intact with the latest Higher High at 11408 and latest Higher Low at 11180.
Please read on to understand our rationale. This article contains an analysis of technical parameters as well as open interest and derivatives data. All the information below has hints for what levels to watch out for in weekly trade. Replicating these on your charting software and keeping an eye on them can help minimize unpleasant shocks in your trading.
Moving Averages
A quick snapshot of how the major Moving Averages are placed on the daily chart.
Ichimoku (D)
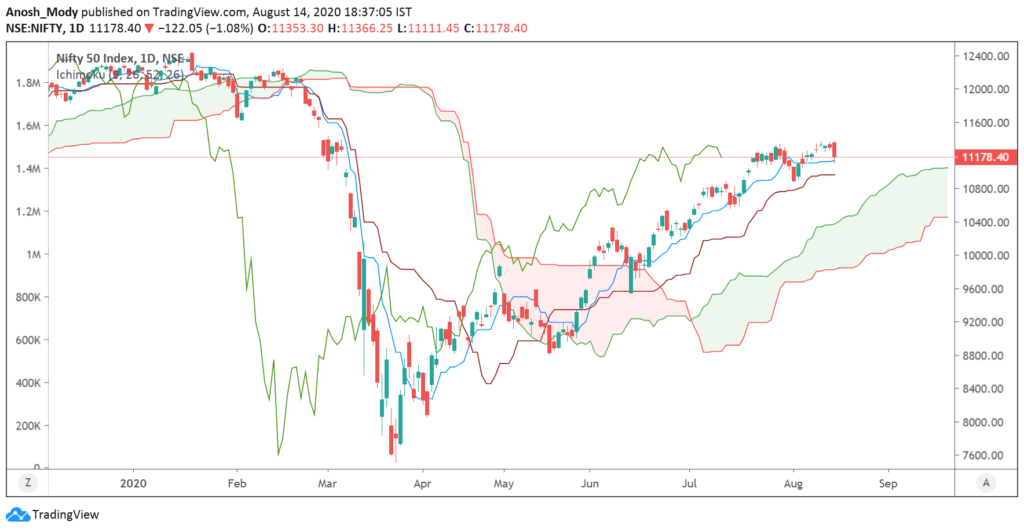
Ichimoku (W)
Nifty intraday
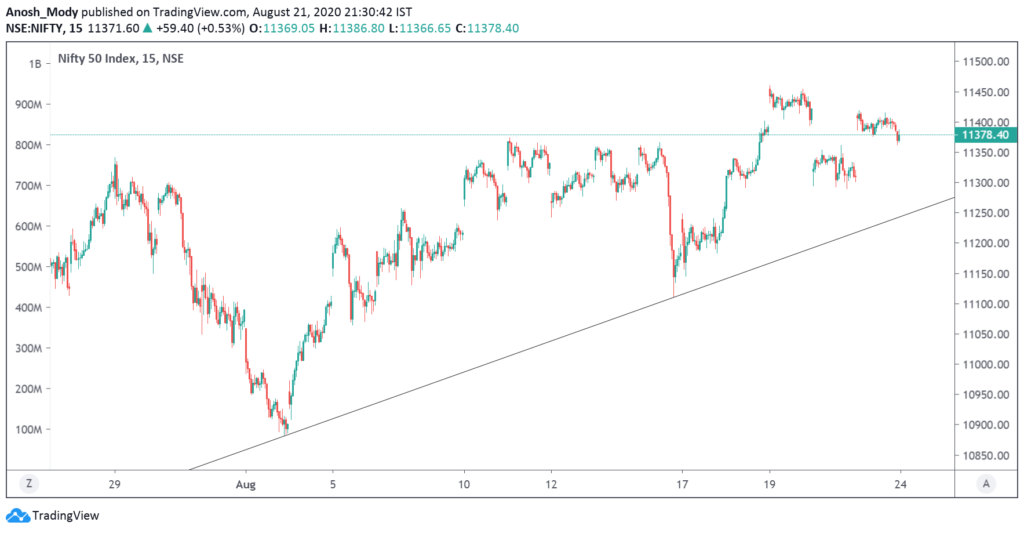
Nifty a strong up-move from Monday to Wednesday, and a sudden shocker on Thursday (an 80 point gap-down)
Most of this was covered with today’s gap opening, and we ended the week right at the major resistance of 11377.
Bank Nifty
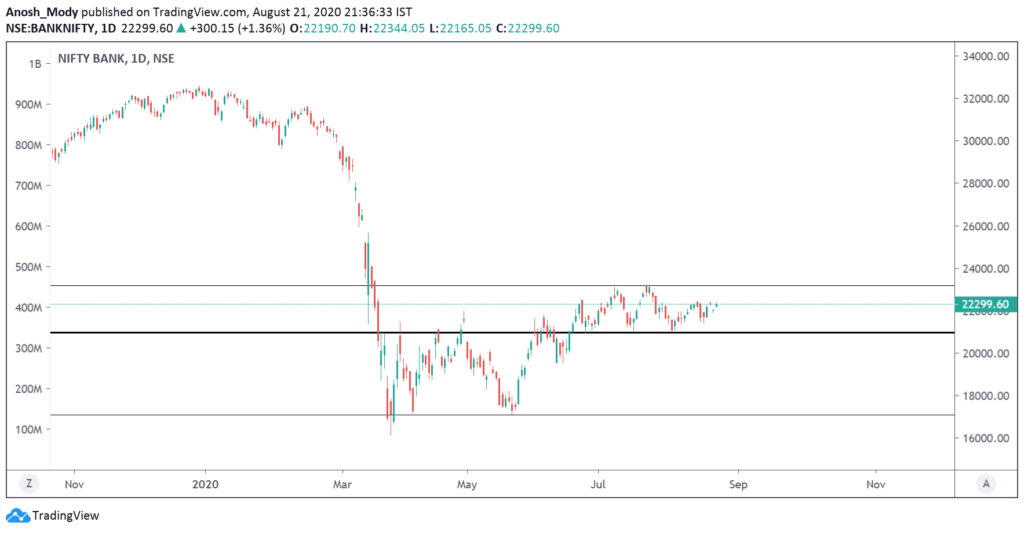
Bank Nifty is still trapped in range. A move outside of 20950 – 23185 will provide more directional clarity.
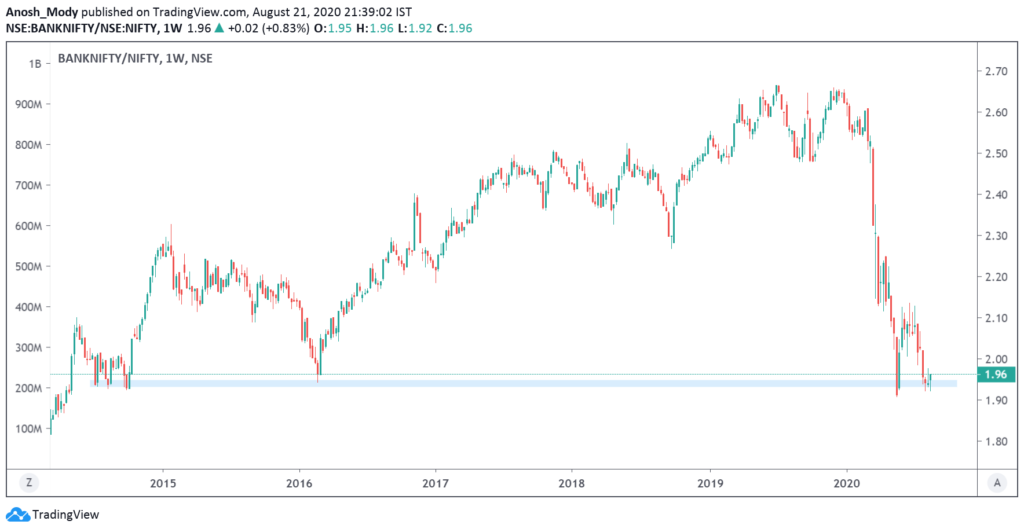
On the relative chart, an interesting BULLISH candle has formed right at the historical support zone. A followup to this can help show some outperformance in Bank Nifty.
OI Analysis:
Open interest or OI is the total number of open positions in the market. A high OI indicates that there is a lot of activity in that instrument. It does not indicate buyers and sellers individually but is instead a more holistic measure, i.e. it is the number of contracts between the buyers and sellers, not the buyers and sellers on their own. One of the ways OI analysis works is that high-volume market participants would have sold strangles at strikes which leads to higher OI. This type of reading does not typically account for other types of spreads that one may trade, but the data for it is available.
Nifty
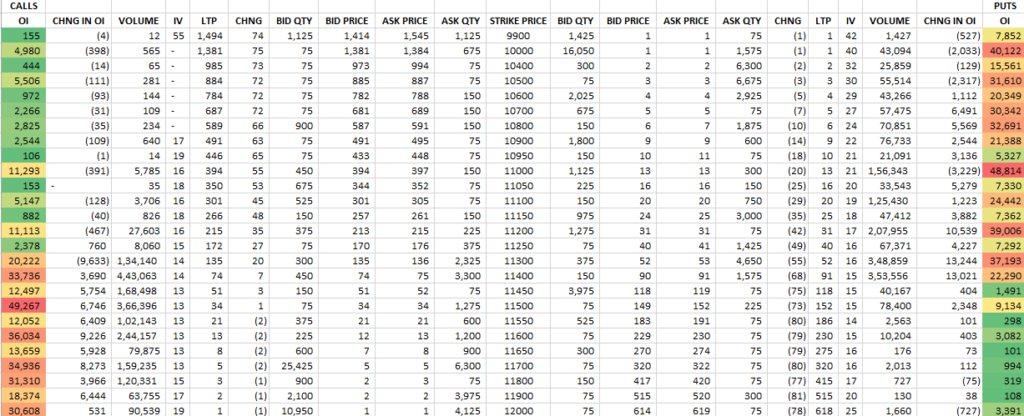
Looking at the OI figures of 27th Aug 2020 expiry, we can make two observations:
- OI on lower strikes is reducing while higher strikes is going up.
- Call OI at higher levels has increased quite a lot, meaning new contracts are being entered into. This may mean that there is some hesitation at higher levels.
- There is strong OI at lower levels on the put side.
This is in principle similar to what we have seen in these past few weeks as well, but what is interesting is that conviction of both, bulls and bears, seems to be higher at this point. We have seen a strong fight between the two sides last week, and the OI data indicates that we may see the fight continue.
Another important observation to note is that the high-OI strikes haven’t changed since nearly one month. This tells us the kind of consolidation we are seeing with Nifty right now, and how it might just be preparing for a breakout or breakdown soon.
Bank Nifty
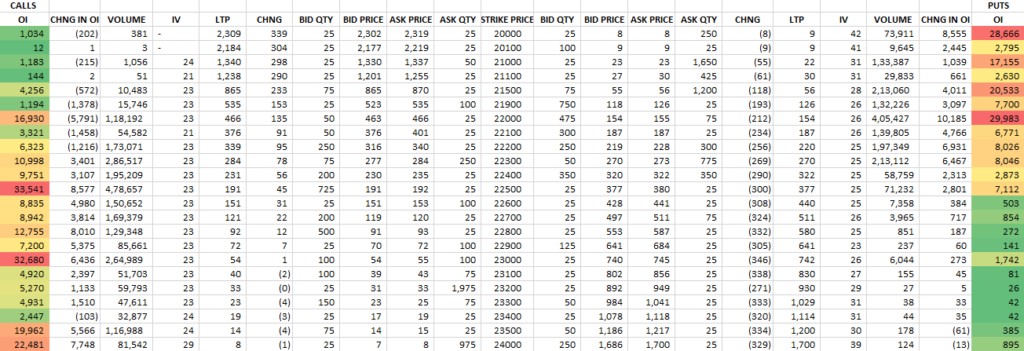
Banknifty has the tendency to move quite a bit more than Nifty which makes the OI figures we see here rather interesting. We typically discuss the range by understanding the highest OI strikes, however we can see that Banknifty’s OI tends to be spread out across several strikes.
Unlike last week, we can see a high call OI at higher levels this time. This may indicate potential resistance. Most of the high OI put strikes do not have a very high premium which is not too attractive for option writers.
In general, Banknfity has been performing slightly better than Nifty, but the overall direction of the two indices might be similar and hence, inferences would be similar too.
Heavyweights in the Nifty 50:
Let’s look at some important stocks in Nifty50 that collectively make up around 42.83% of NSE’s flagship broad market index. The analysis is done on both, Daily and Weekly timeframes. Charts displayed are either Daily or Weekly depending on which provides a clearer picture.
The weights used as per the most recent NSE press release available, dated July 31st 2020. Compared to the previous period’s, this period has seen some major changes including Infosys replacing HDFC for the number three spot and TCS replacing ICICI Bank for the number five spot. This is most likely due to the strong performance delivered by IT stocks in the past couple of weeks. Interestingly, the overall weightage of the top five stocks continues to increase MoM.
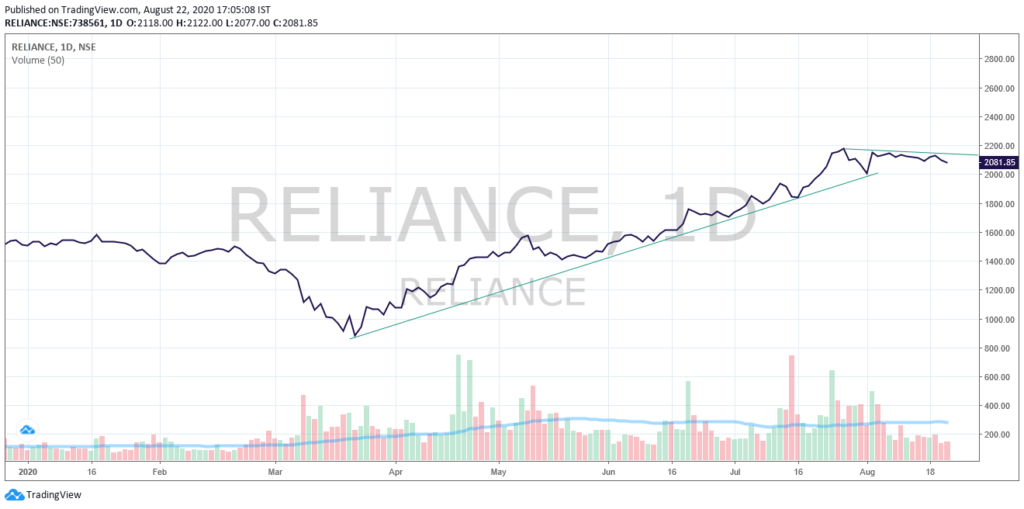
1. Reliance (14.00% weight): We looked at Reliance’s line chart last week as it shows us a more linear and cleaner picture of how the trend looks like. Up until now, Reliance had respected the trendline very well. However, with the AGR dues related choppiness, Reliance breached that clean trendline. The past week has also proven that 2065-2075 is an important support level for RIL, but with the bearish bias seen these past few days, a 2000 retest may be considered a plausible scenario. While volumes have shrunk, retail players have bought at every dip in Reliance which is evident in the intraday market depth ticks. (Read the Basics of Dow Theory and trend by clicking here).
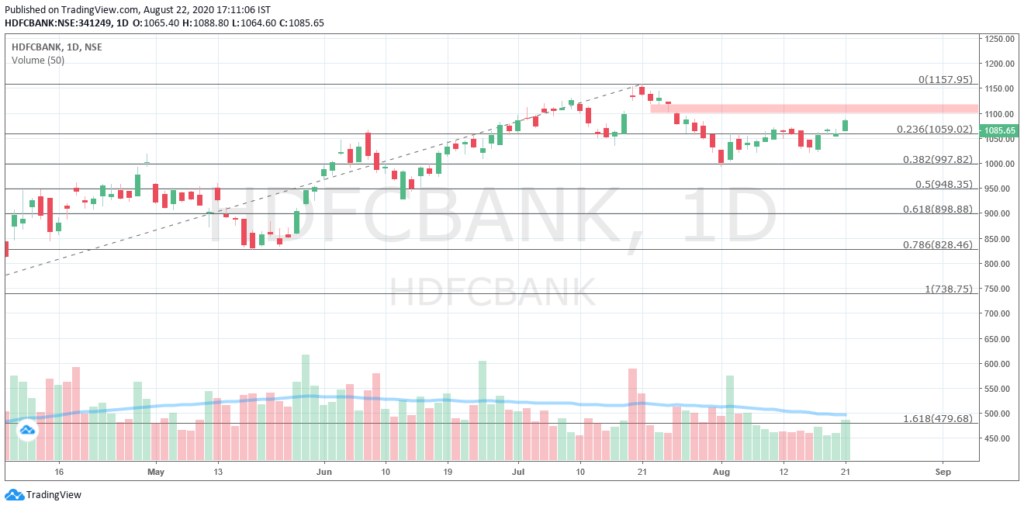
2. HDFCBANK (9.56% weight): After facing tight resistance between 1066-1070, HDFC Bank has finally broken out after some fantastic moves last week. Resistance around 1100 is imminent but depending on buying strength, it may be cleared soon. Volumes dried up last week but they managed to catch-up this week on two relatively high volume days.
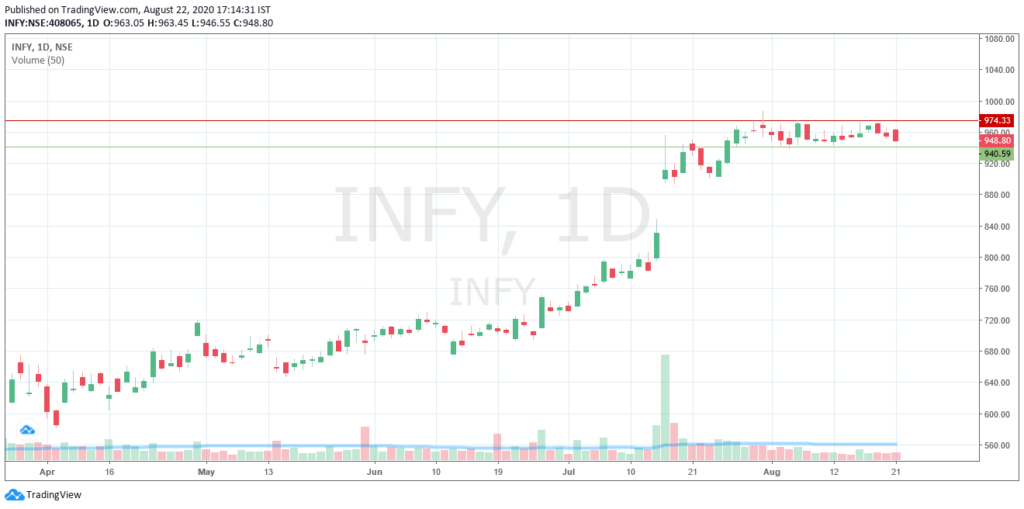
3. Infosys (7.56% weight): Infosys faces stiff resistance at higher levels and we see it forming higher highs and higher lows. This is not a good sign. It is important for the stock to hold 950 if it wants to breach the resistance at 975. However, with selling volumes only growing, unless there is something strong either with the industry or with Infosys, we might not see the level being held.
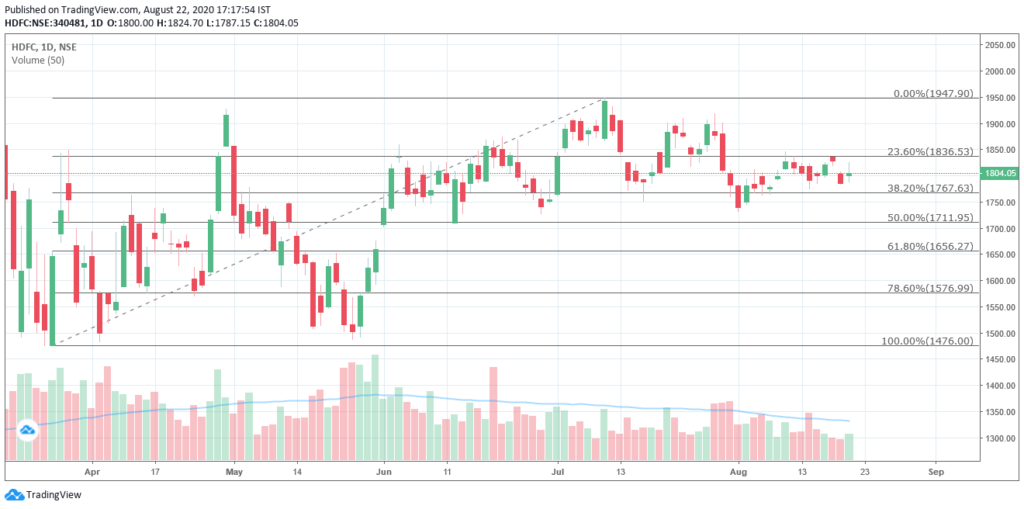
4. HDFC (6.59% weight): HDFC continues to move in a haphazard manner, sandwiched very tightly between the two Fibonacci levels mentioned in the chart below. The broader term direction of HDFC seems to be on the bullish side as we can see a mild higher high and higher low being formed, but if we were to draw a trendline it would have a very flat slope. It’s important for it to hold on to 1760!
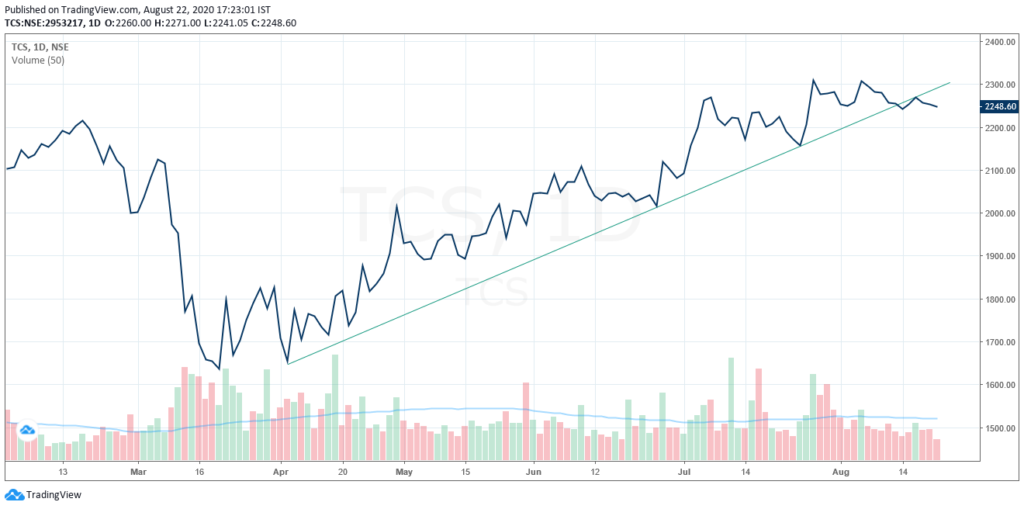
5. TCS (5.12%): We still stand by last week’s analysis of 2200 being an important level for TCS. Both IT giants part of our Nifty analysis seem to be lagging, but TCS is respecting the trendline much better. We can see how the volumes are drying up and the line which was once a support became a resistance for TCS. Volumes drying up at lower levels could be a positive sign if it signifies sellers stepping out and buyers stepping in. However, this hinges entirely on how much conviction the bulls have.
Heavyweights in Banknifty:
Since we have started analysing Banknifty in Market Chronicles, we decided to include some top movers of Banknifty. The number one mover is HDFC Bank, which has already been spoken about in the previous section, so we will discuss two other important stocks here, namely Kotak Bank and SBI. Other banks have an impact on the index, but these along with ICICI Bank are typically the movers.
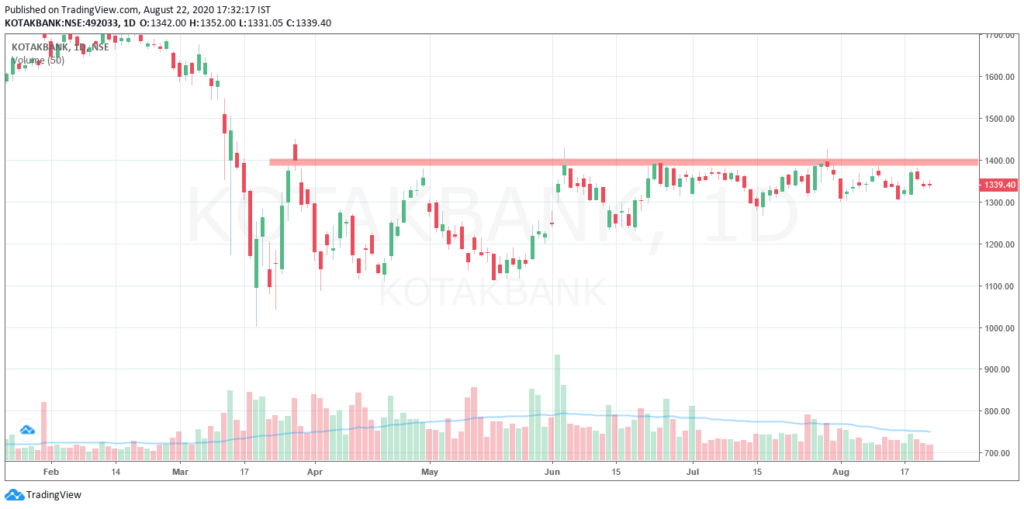
1. Kotak Bank: The 1285 support level we discussed last week worked like magic on Kotak Bank. However, it faces resistance from one of its supply zones. Unless buyers are able to drive the price above the highlighted levels decisively, sellers may continue controlling higher prices.
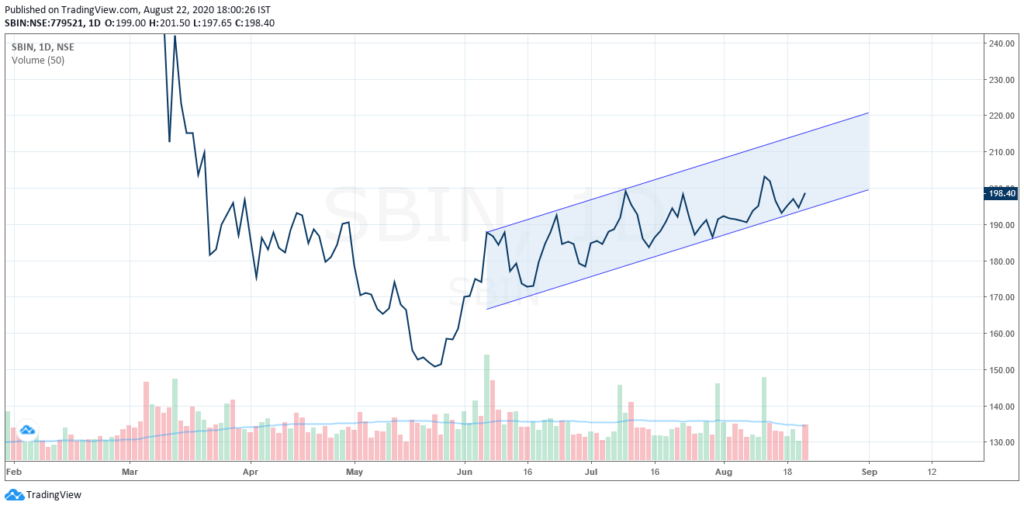
2. SBIN: After testing 200 levels, SBI came back to 196-199 where it now rests. We can see how cleanly it has respected the support within the channel, but resistance at 200 might be too tough to breach unless strong buyers enter the market. Additionally, with the government announcing offloading of stake in PSU undertakings, it may have caused some unsteady sentiments with PSU stocks overall. As long as the trendline is respected, we continue to remain bullish on SBI.
Volatility:
VIX continues to fall, but based on intraday price movements and overall sentiments, we believe that the actual price movements are not very well described by INDIA VIX this time around. If the markets continue climbing a wall of worry, we may continue seeing lower VIX levels, until it doesn’t. When VIX may just spike. This past week has been incredibly choppy in terms of price movements, with massive gap openings seen on intraday charts, too. These details are not captured by VIX which may be why we see it continuing to fall.
VIX has steadily fallen while the market continues to gain. The long wicks on the lower side indicate the few sharp dips that we are experiencing intraday. Closing below 20 is an important feat for VIX and it shows that the volatility is slowly and steadily coming back to pre-COVID levels as the market goes up.
For your reference, a lower VIX (or lower volatility) is generally associated with price moves that are less choppier and more trending. It also results in lower option prices (due to a lower IV). But at the same time, the ATR (Average True Range) of the stock would be narrower.

If you’re new to technical analysis and would like to know how to read the charts below, here’s a quick guide!
Disclaimer:
We, Anosh Mody & Krunal Rindani shall take no responsibility for any losses occurring out of investment/trading decisions you make based on the contents of this article.
We are not SEBI registered investment advisors. This article is meant for educational purposes only, please consult your investment advisor before acting upon any information you see here.
We may or may not have open positions, kindly assume that we are biased.
Anosh Mody is an MBA student from SBM, NMIMS Mumbai. However, the views reflected in this article are strictly his own, and in no way reflect upon the B-School in any manner.
Follow Us @
Some Unrelated Stories!


