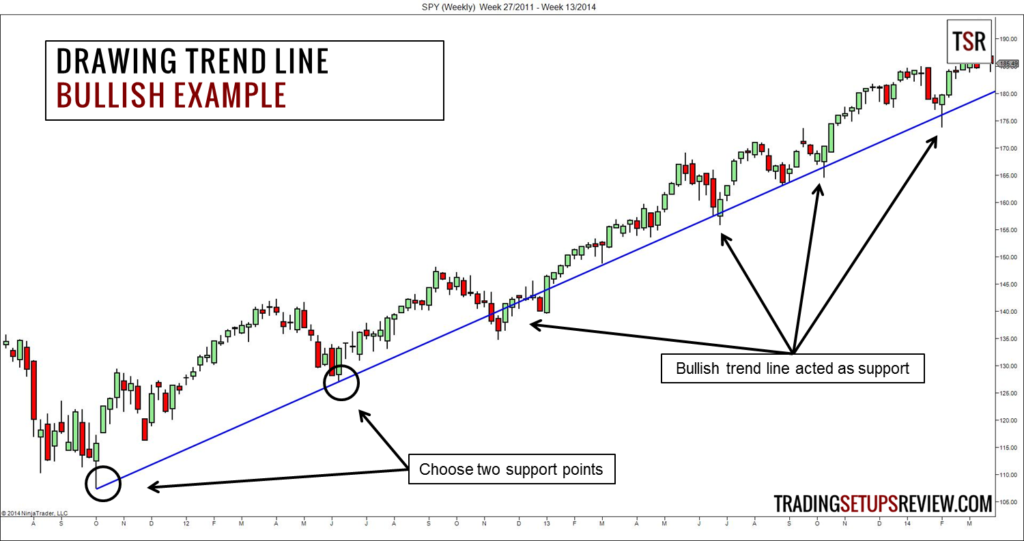
These are lines which connect consecutive swing highs or lows. If drawn correctly they can serve as excellent entry/exit indicators in a trade
Some important things to know about trendlines:
- If price is forming lower highs and lower lows, a trendline connecting the lows is not valid. A trendline connecting the highs is valid though.
- If price is forming higher highs and higher lows, a trendline connecting the highs is not valid. A trendline connecting the lows is valid though.
- The steeper the trendline, the less likely it is to hold.
- The more number of contact points with price that the trendline has, the higher it’s reliability.
Typically, it requires 2 swing highs/lows to draw a trendline, and a 3rd point of contact to confirm its validity. This trendline can now be extended into the future and shall remain valid until breached. (Personal observation; trendlines once breached reverse their role, ie support trendlines act as resistance once breached and vice versa)
Bro tip: If confused how to draw the trendline on a candlestick chart ie you’re not sure if you should be selecting the wicks of the candle or the bodies, draw the line that provides maximum points of contact with price without breaches. If it’s still confusing, shift to line charts for the purpose of drawing the line, and then shift back to candlesticks. Often, price clusters are formed just about breaching the trendline before continuing to honour the trendline, and these anomalies should not be treated as a true breach of the line.
This is a perfect trendline. It also shows a price cluster which appeared to breach the trendline but didn’t really do so.

Bearish Trendline example:

