Market Chronicles for the week ended 10th July, 2020.
Nifty ended the very tight range week 1.51% in the green, with most of this gain being contributed by the Monday gap-up. Our outlook remains HIGHLY CAUTIOUS, and anyone who trades would agree that the outlook is quite valid, given how it was very difficult to make money on both the long and the short side!
Please read on to understand our rationale. This article contains an analysis of technical parameters as well as open interest and derivatives data. All the information below has hints for what levels to watch out for in weekly trade. Replicating these on your charting software and keeping an eye on them can help minimize unpleasant shocks in your trading.
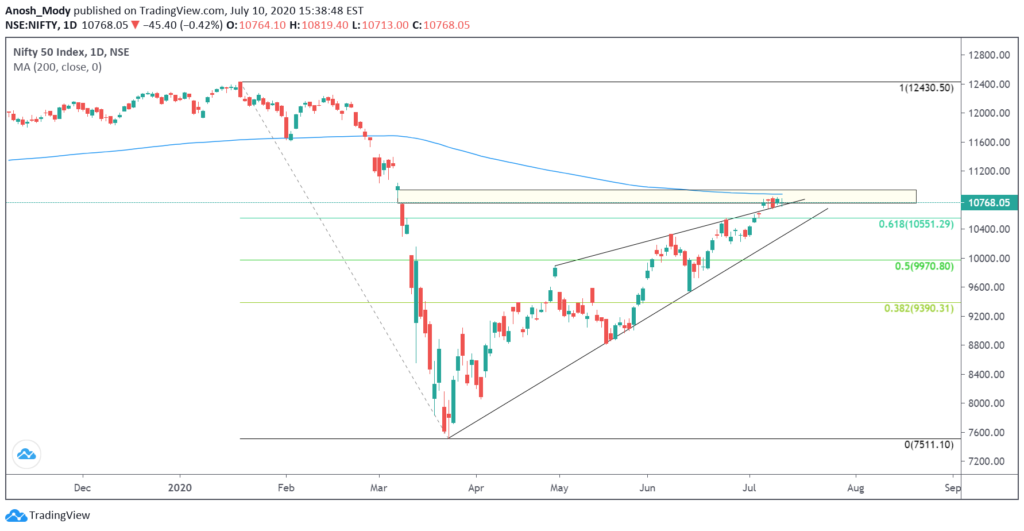
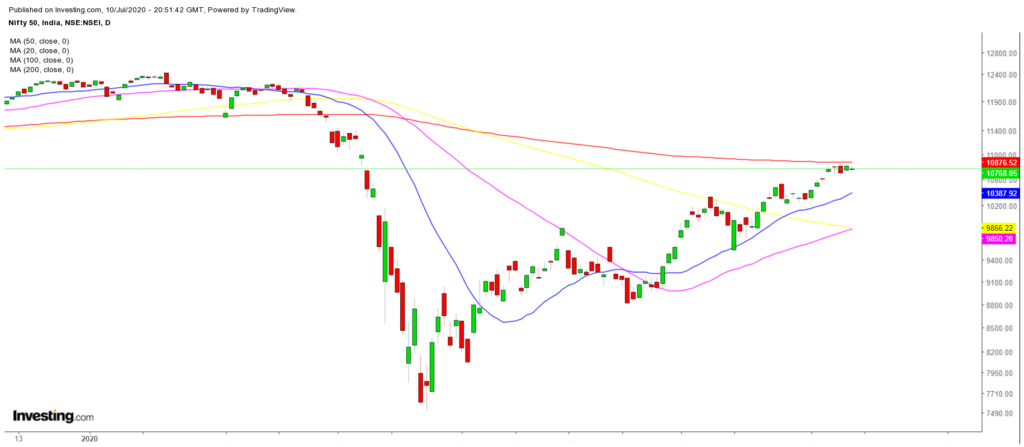
The break above 200 Weekly MA1 and 61.8% fib level2 sustained well. Monday’s gap up provided good support too.
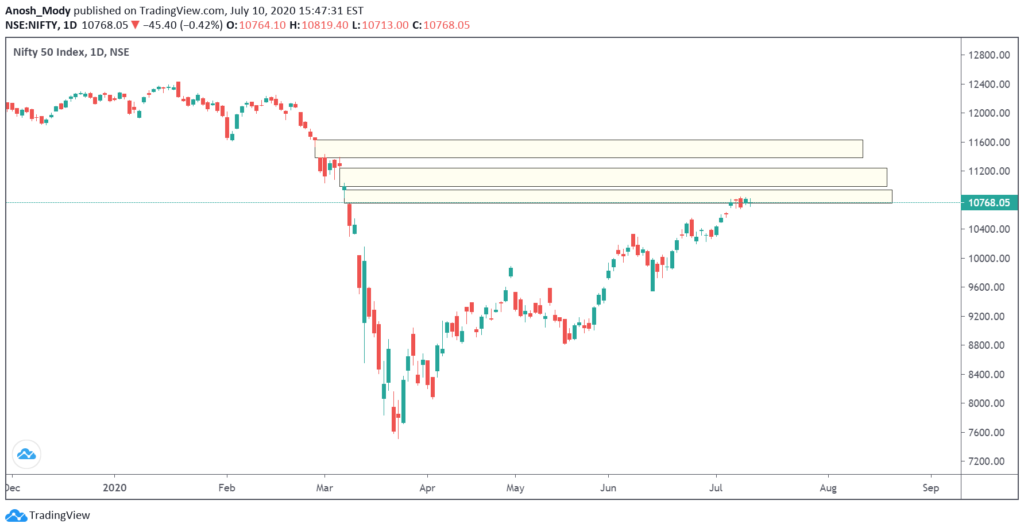
However price couldn’t cross 200 Daily MA, and consolidated right below it in a tight range within the gap of 9th March.5
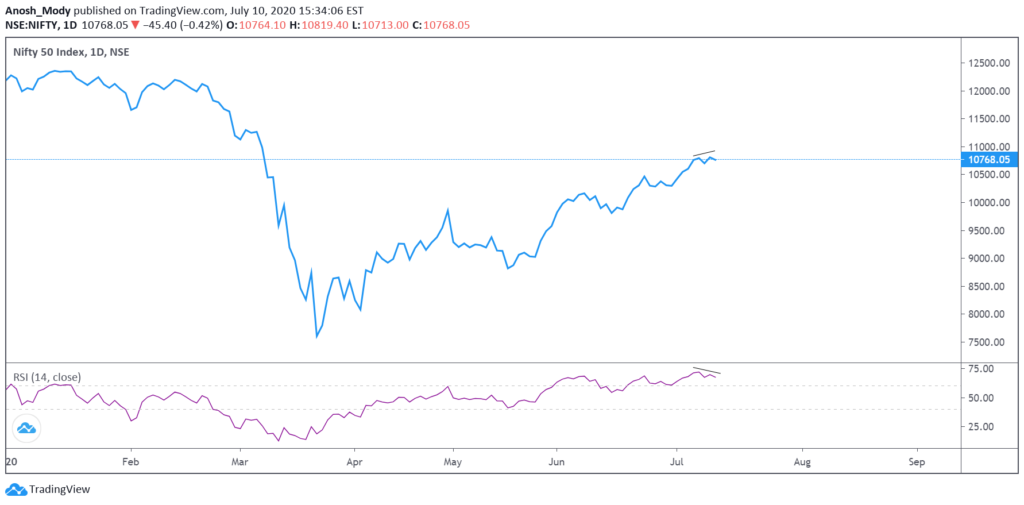
There is a tiny bearish divergence on RSI. The latest higher low is at 10700, but the major swing low is at ~10200. The uptrend will be challenged if there is a close below these levels on a daily closing basis. Till then, the intermediate uptrend remains!3
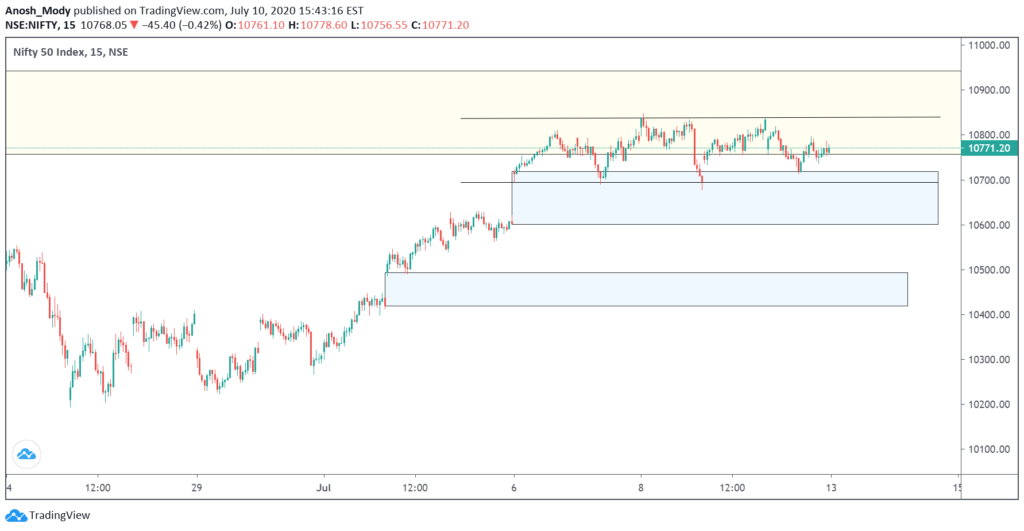
Nifty 15 minute Chart
We expect to see a large trending move once the range of 10677-10847 is decisively taken out. Gaps marked for reference5
Open interest6 or OI is the total number of open positions in the market. A high OI indicates that there is a lot of activity in that instrument. It does not indicate buyers and sellers individually but is instead a more holistic measure, i.e. it is the number of contracts between the buyers and sellers, not the buyers and sellers on their own. One of the ways OI analysis works is that high-volume market participants would have sold strangles at strikes which leads to higher OI. This type of reading does not typically account for other types of spreads that one may trade, but the data for it is available.
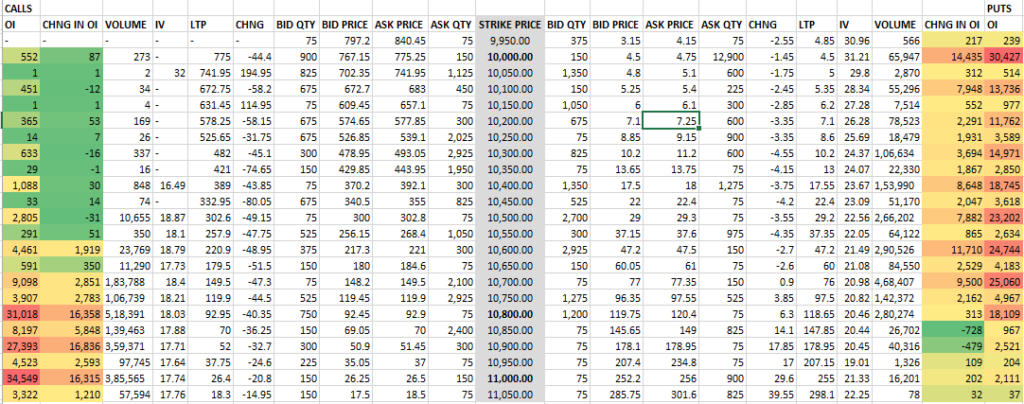
Looking at the OI figures of 16th July 2020 expiry, we can see that the range is slated to be between 10,000 and 11,000. However, similar to last expiry, the OI at these strikes is not that high. In fact, the strikes at either extreme ends have premiums of around 4pts which is very low to attract option writers.
This implies that the narrower strikes as highlighted and emboldened will be important as they have established a reasonable range for the week and offer a good premium for option writers as well.
As we explored in the Nifty analysis, the past week was largely flat with higher and lower levels being rejected. This means that unless the past week’s range can be broken decisively, we may continue seeing range bound movements which would eat option premium as well.
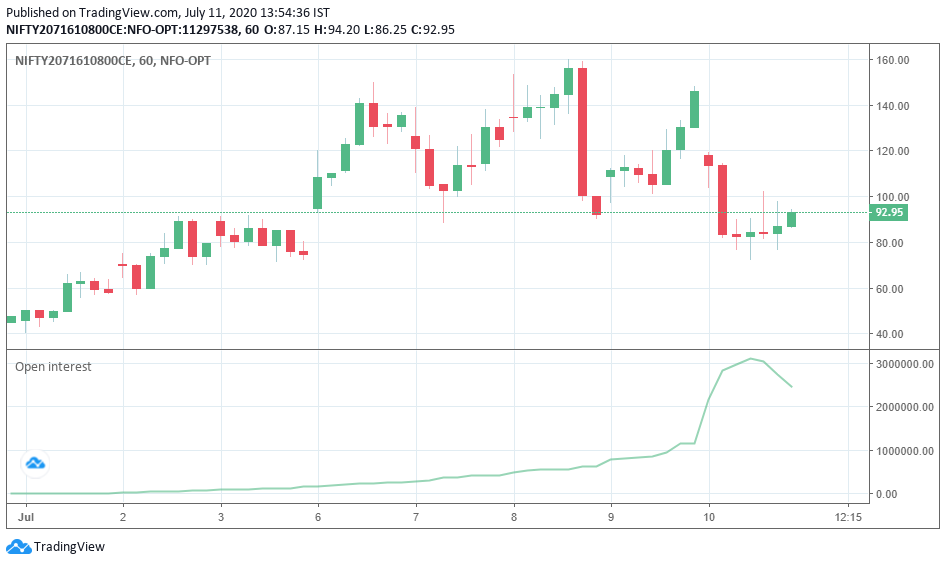
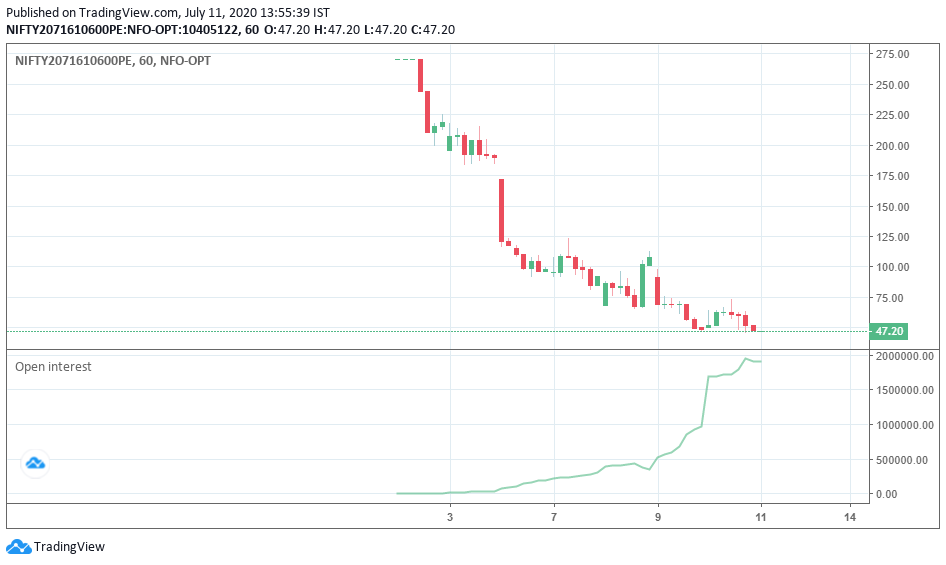
Looking at the Open Interest charts of the high-OI strikes, we can see that call writing is quite significant at higher levels of 10800 and put writing is quite high at lower levels of 10600. However, it is important to understand that these levels are never set in stone as strikes can be rolled in either direction.
Heavyweights in the Nifty 50:
Let’s look at some important stocks in Nifty50 that collectively make up around 41.55% of NSE’s flagship broad market index. The analysis is done on both, Daily and Weekly timeframes. Charts displayed are either Daily or Weekly depending on which provides a clearer picture. While analyzing these stocks, please consider the broad-market strength which is not as strong as it was last week. This may have an impact on the top stocks of Nifty and hence, may move the stocks in a different direction than what one may expect. We have included Volume data this week.
The weights used as per the most recent NSE press release available, dated June 30 2020. Compared to the previous period’s, this period has seen an increase in the weightages of the top five Nifty companies we feature. Additionally, HDFC Life Insurance has replaced Vedanta Ltd.
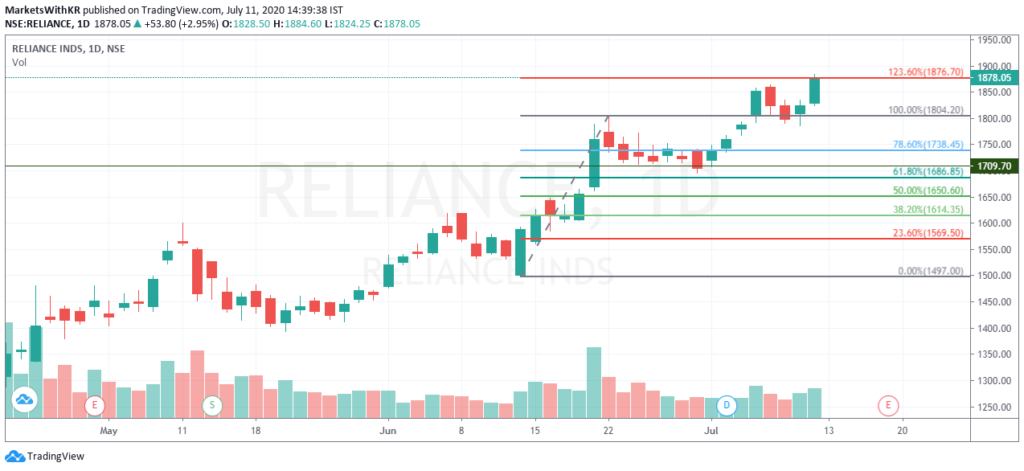
1. Reliance (12.45% weight): Reliance has been making very strong moves consistently since the initial paranoia and panic selling reduced. This past week has been especially strong for Reliance as despite negative/flat market cues, it continued to make an ATH just shy of 1900 after some profit booking. The Daily chart shows us that Reliance stalled right at its 123.6% Fibonacci extension level. Given this resistance, it may be worthwhile to see Monday’s open before initiating new longs. The stock is inherently very strong and has a good positive sentiment as well. However, it is best to remain cautious especially since broad market uncertainty still remains.
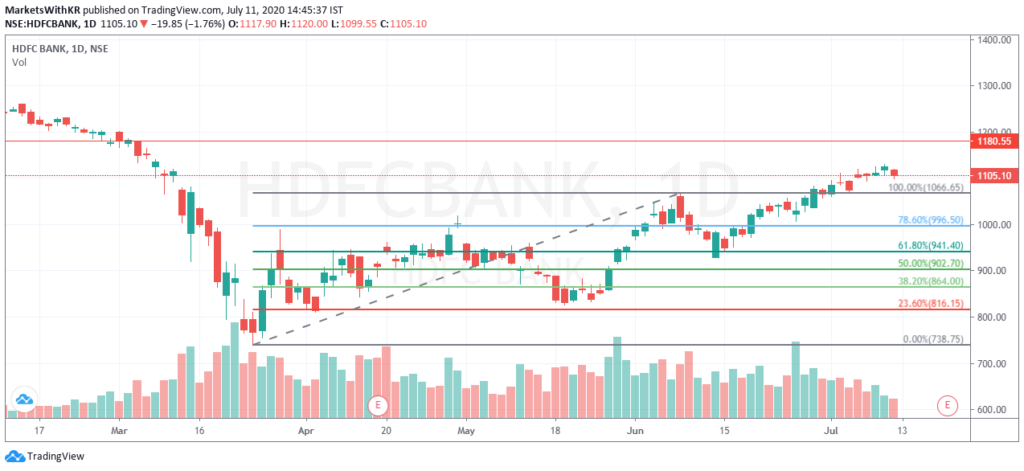
2. HDFCBANK (10.65% weight): HDFC Bank has seen a good steady uptrend this week despite some resistance at higher levels. It managed to fill in the gap (denoted by the horizontal line) and then made a lower high and lower low. The week brought some positive sentiments for HDFC Bank, but because HDFC performed quite strongly, HDFC Bank followed suit. The candlestick patterns clearly indicate resistances at higher levels and lower volumes. These signs may point towards a lack of willing participants at these levels among uncertainty.
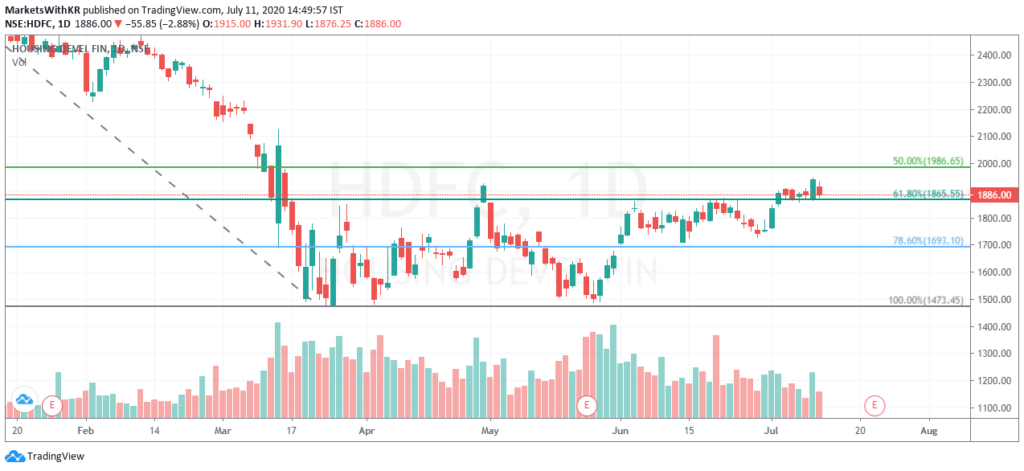
3. HDFC (6.99% weight): HDFC has managed to breach a very important resistance that it faced since the initial selloff and has even taken support at that price level. If the 1865 level is respected, we could see a move up to 1986 soon. However, rejection of this level may mean that HDFC is headed towards an important support of 1693. While this is a wide range, such movements are not unheard of in HDFC.
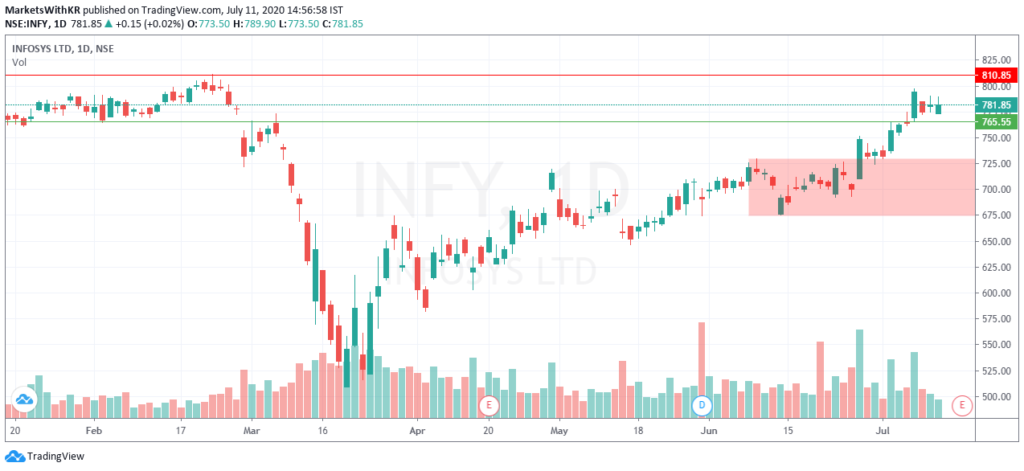
4. Infosys (6.21% weight): Infosys has had a great week. This stock continues to be one of the best examples of inside bar breakouts. The red highlights show our marked levels from two weeks ago (supports later revised). We can see how post breakout of those levels, it has managed to show very swift up moves. In fact, Infosys has also taken support at the upper edge of our range. Going forward, we expect some resistances approaching 800 and above levels with support at 765. There are a few gaps around these levels. This combined with the steep climb INFY witnessed may make for some choppy moves which may include profit booking, but the stock appears positive above 765.
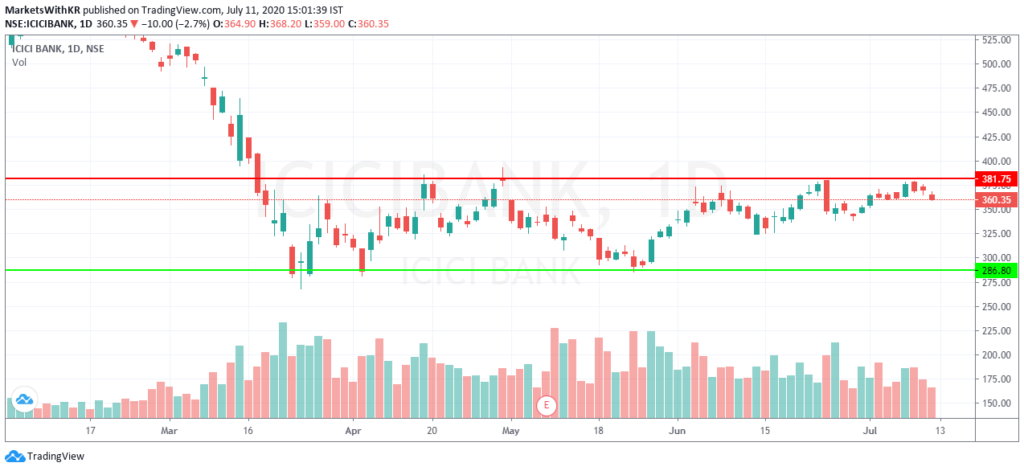
5. ICICI Bank (5.25%): ICICI Bank remains to be one of the weakest stocks in the list. It has been unable to break out of the range that it has been stuck in since the price fell during the initial few days of the COVID-19 outbreak. This is unlike many other stocks (especially large caps) that have managed to recover a fair bit from their swing lows. Our view is quite similar to what it was last week as it really has not moved enough. 381 appears to be a good supply zone for ICICI Bank and until it is able to breach this level, we may not see very decisive positive moves. It is known that the market moves in the way of least resistance, and that appears to be towards 320-340 for this stock as of now, even according to Fibonacci retracement levels that are not pictured below.
Volatility:
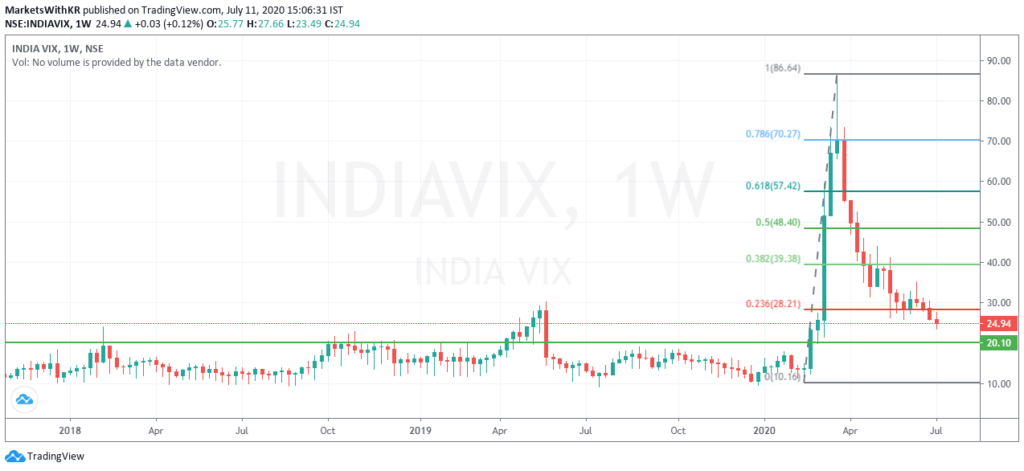
VIX continues to fall, but based on intraday price movements and overall sentiments, we believe that the actual price movements are not very well described by INDIA VIX this time around. If the markets continue climbing a wall of worry, we may continue seeing lower VIX levels, until it doesn’t. When VIX may just spike.
The point we intend to drive here is that VIX does not move solely based on the chart’s support and resistances. Hence, keeping in mind that uncertainty still exists, it would not be appropriate to decisively conclude that VIX is stabilizing.
Additionally, VIX appears to have a support at 20 which may be the next hurdle.
For your reference, a lower VIX (or lower volatility) is generally associated with price moves that are less choppier and more trending. It also results in lower option prices (due to a lower IV). But at the same time, the ATR (Average True Range) of the stock would be narrower.
Disclaimer:
We, Anosh Mody & Krunal Rindani shall take no responsibility for any losses occurring out of investment/trading decisions you make based on the contents of this article.
We are not SEBI registered investment advisors. This article is meant for educational purposes only, please consult your investment advisor before acting upon any information you see here.
We may or may not have open positions, kindly assume that we are biased.


