Market Chronicles for the week ended 3rd July, 2020.
Nifty ended the week a strong 2.16% in the green! Our outlook is now changed to HIGHLY CAUTIOUS.
Please read on to understand our rationale. This article contains an analysis of technical parameters as well as open interest and derivatives data. All the information below has hints for what levels to watch out for in weekly trade. Replicating these on your charting software and keeping an eye on them can help minimize unpleasant shocks in your trading.
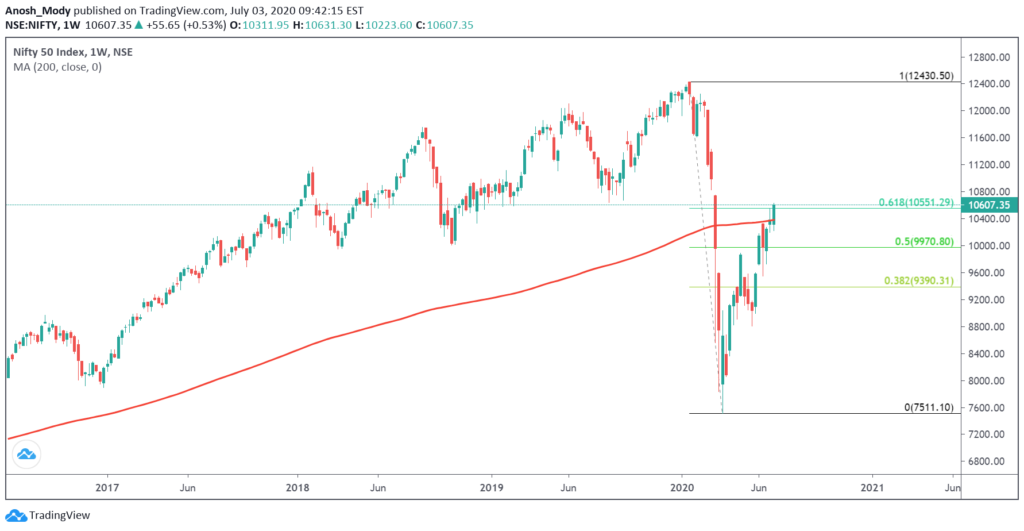
On the weekly charts, we closed above 2 very important resistance levels, the 200 Weekly Moving Average1 and the 61.8% fibonacci retracement2.
As we know, the last time 200 WMA was won back by the bulls was in May 2009, post which saw a rally back to the then All Time High of 6315.
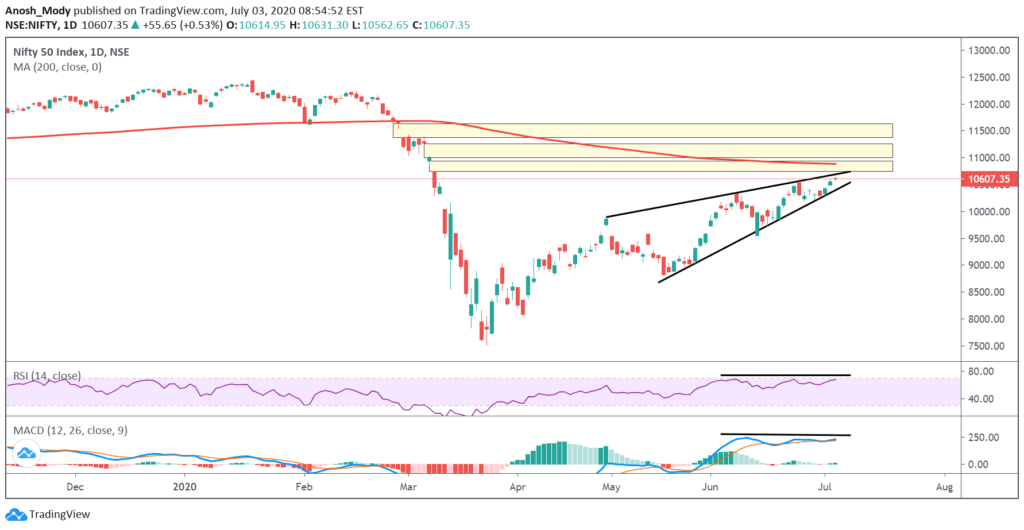
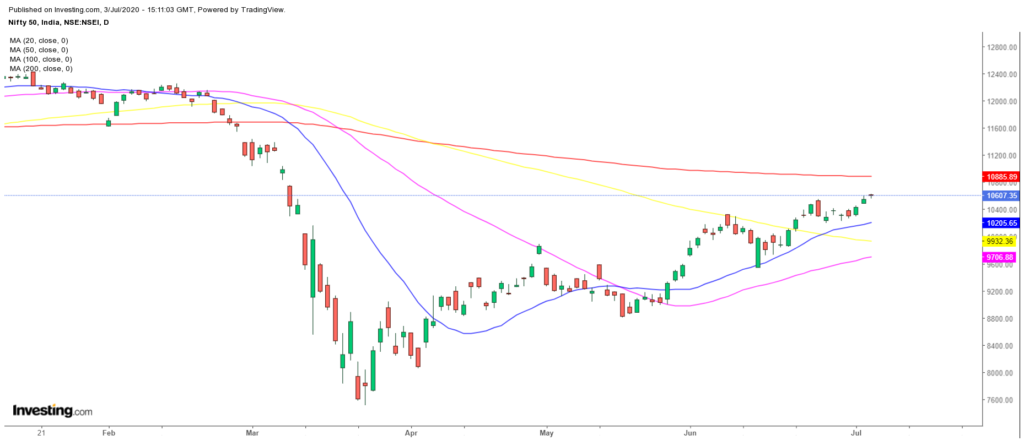
However looking at the daily chart, we are at the fag-end of the rising wedge. A momentum divergence has built up, and the road upward for Nifty is fraught with resistance, viz 200 DMA1 and several open gaps5. It’s hard to be bullish till these signals are negated.
We are not bearish just yet because the trend has not bent over 3. Immediate level for bulls to defend the trend is 10285 – 10300, and then 9800-9900 are crucial; below which we can see a swift and terrible fall. The pattern target suggests 8800 – 9000 could be on the cards if that scenario were to play out. Please note that these are mere possibilities and not targets.
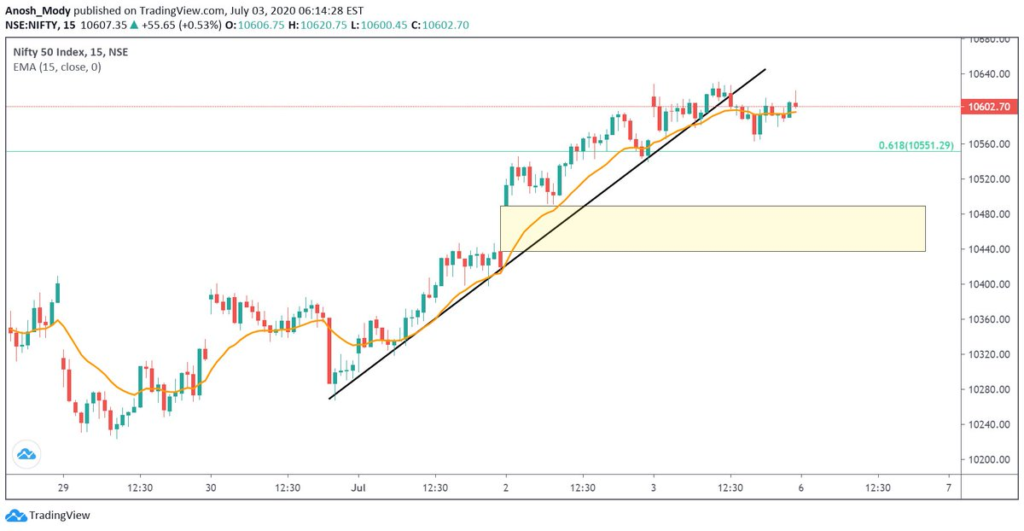
On the 15 minute chart, we see a breach of the upward trendline4. A move below 10550 could lead to gap5closing till 10440.
Moving Averages:
A quick snapshot of how the major Moving Averages are placed on the daily chart.
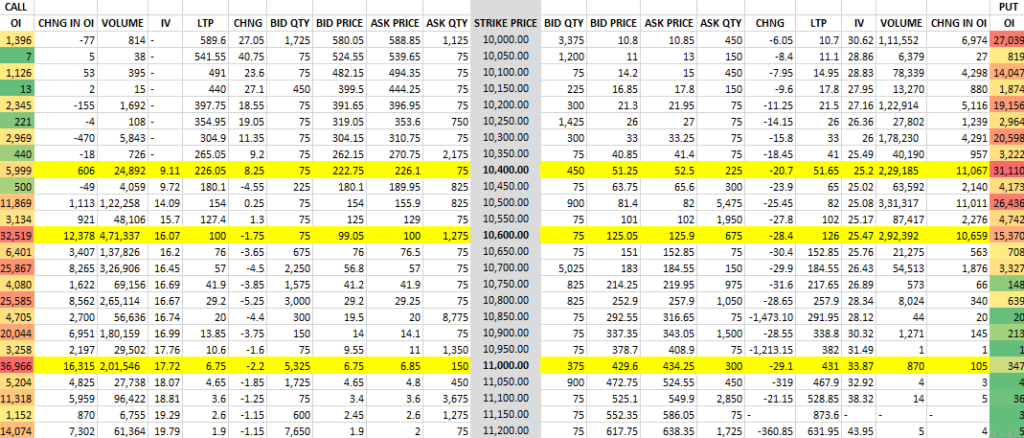
OI Analysis:
Open interest6 or OI is the total number of open positions in the market. A high OI indicates that there is a lot of activity in that instrument. It does not indicate buyers and sellers individually but is instead a more holistic measure, i.e. it is the number of contracts between the buyers and sellers, not the buyers and sellers on their own. One of the ways OI analysis works is that high-volume market participants would have sold strangles at strikes which leads to higher OI. This type of reading does not typically account for other types of spreads that one may trade, but the data for it is available.
Looking at the OI figures of 07th July 2020 expiry, we can see that the range is slated to be between 10,400 and 11,000. However, what is concerning is that the OI at these strikes is not as high. This implies that the confidence of market participants is not that high.
Additionally, in the past we have only looked at OI analysis from a short strangle point of view. This means, we were expecting the prices to be between the range we specified. However, based on the aforementioned analysis of Nifty and uncertain global markets, we may expect some bearishness and if the coming week’s moves are large, we may have to consider long strangles being entered into as well. Essentially, we could expect a significant positive or negative move on either side.
The 10600 strike shows reasonable OI on both Call and Put sides which may indicate long straddles being created there as well. This may mean we could see a move in this coming week more than 200 or so points away from Nifty levels of 10,600.
Since these are direction-neutral strategies, it cannot be ascertained whether the bias is bullish or bearish in this case.
Looking at the Open Interest charts of the high-OI strikes, we can see that call writing is quite significant. This indicates a fairly bearish view above 10,600 Nifty level.
Heavyweights in the Nifty 50:
Let’s look at some important stocks in Nifty50 that collectively make up around 41.55% of NSE’s flagship broad market index. The analysis is done on both, Daily and Weekly timeframes. Charts displayed are either Daily or Weekly depending on which provides a clearer picture. While analyzing these stocks, please consider the broad-market strength which is not as strong as it was last week. This may have an impact on the top stocks of Nifty and hence, may move the stocks in a different direction than what one may expect.
The weights used as per the most recent NSE press release available, dated June 30 2020. Compared to the previous period’s, this period has seen an increase in the weightages of the top five Nifty companies we feature. Additionally, HDFC Life Insurance has replaced Vedanta Ltd.
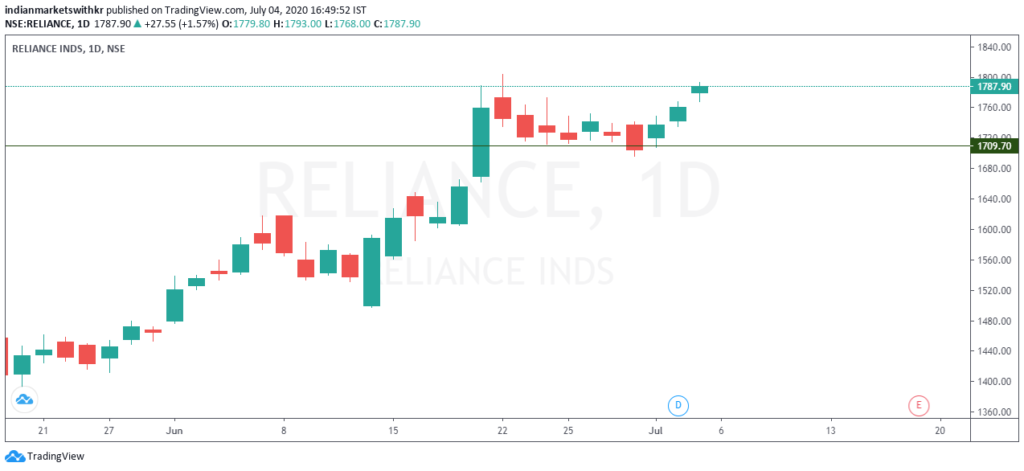
1. Reliance (12.45% weight): The daily chart of Reliance (included below) shows us that while the previous base of 1710 was rejected, the 1700 psychological level was accepted very well. Most of the week was quite positive owing to a good broad-market performance as well as news of Intel investing in the Jio platforms. A close above or close to 1800 would have signalled a very strong week ahead, but since that wasn’t the case, we may experience some resistance around 1800 especially if the broad-market performance is not too confidence inspiring. Conversely, Reliance is one such stock which can move independent to the broad-market if it has strong reasons (new events or sentimental factors).
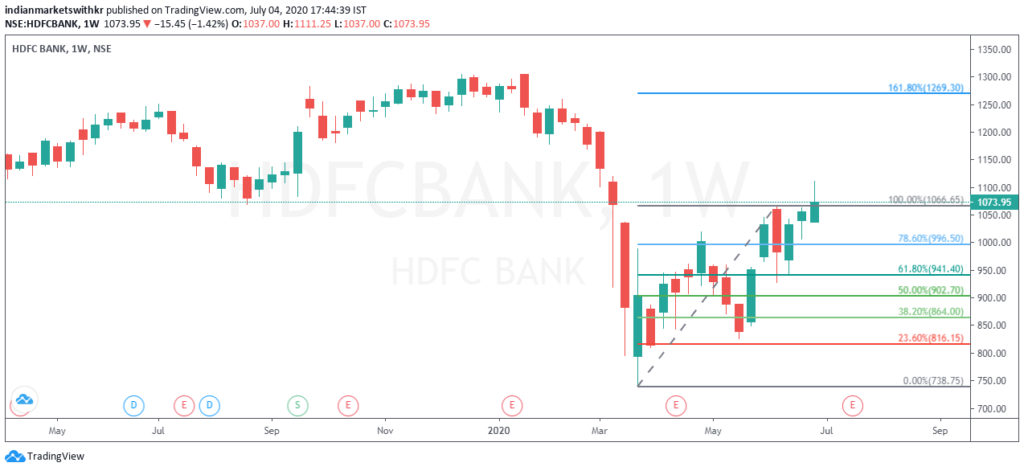
2. HDFCBANK (10.65% weight): The banking giant indicates some hesitation at higher levels. While it has managed to close above an important resistance (purple line on the chart), the longer upper wick indicates significant selling pressure/hesitation at higher levels. This is a sign of weakness and hence if 1060-1066 is not sustained, the stock may test lower levels in the coming weeks.
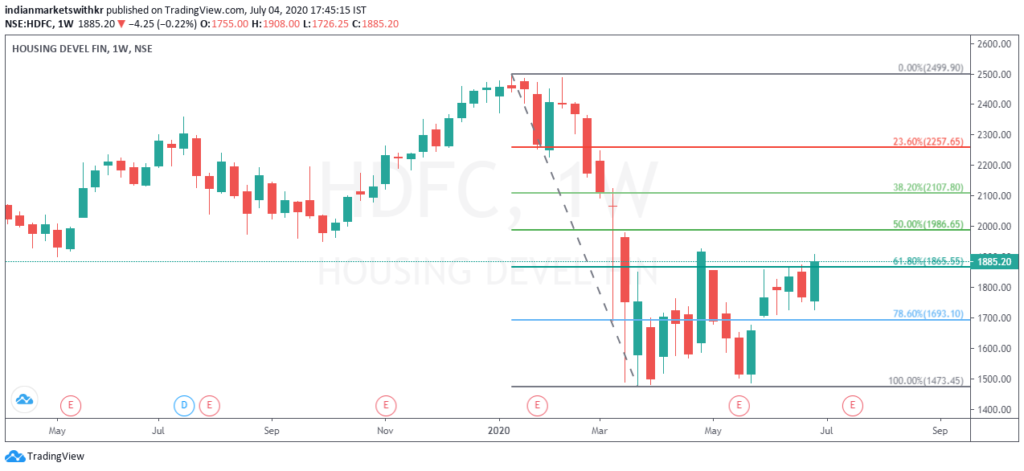
3. HDFC (6.99% weight): While HDFC Bank indicates weakness at higher levels, HDFC shows strength with a bullish engulfing pattern being formed along with a close above the Fibonacci retracement level. With sufficient momentum, it should be able to breach the resistance levels immediately ahead and may slow down right around the gap or the next Fibonacci retracement level. On the bearish side, we could expect some support from 1830-1865.
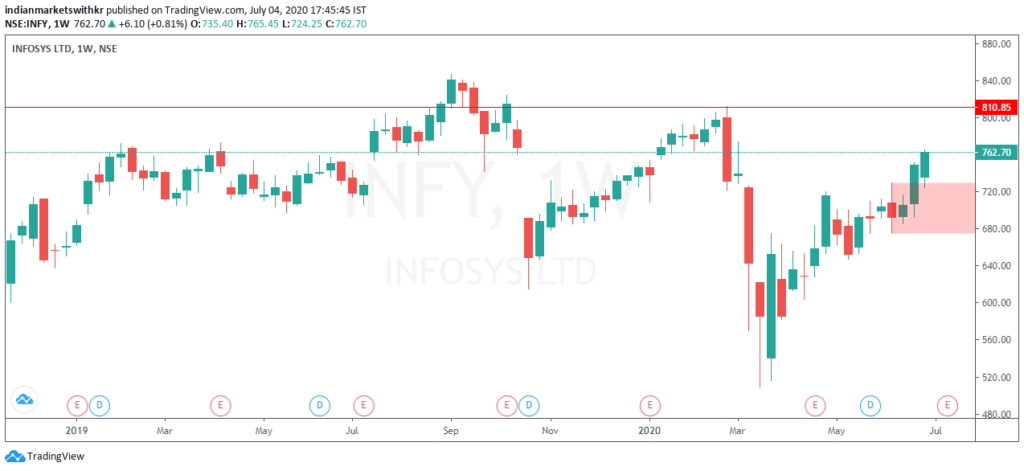
4. Infosys (6.21% weight): Infosys has made some very strong moves this past week. Two weeks ago, we discussed how a close above the highlighted red area could indicate a potential breakout thanks to the inside bar pattern. So far, the stock has respected this and has made higher highs and higher lows. A minor slowdown or profit booking may be likely soon, but the broader trend appears to be bullish.
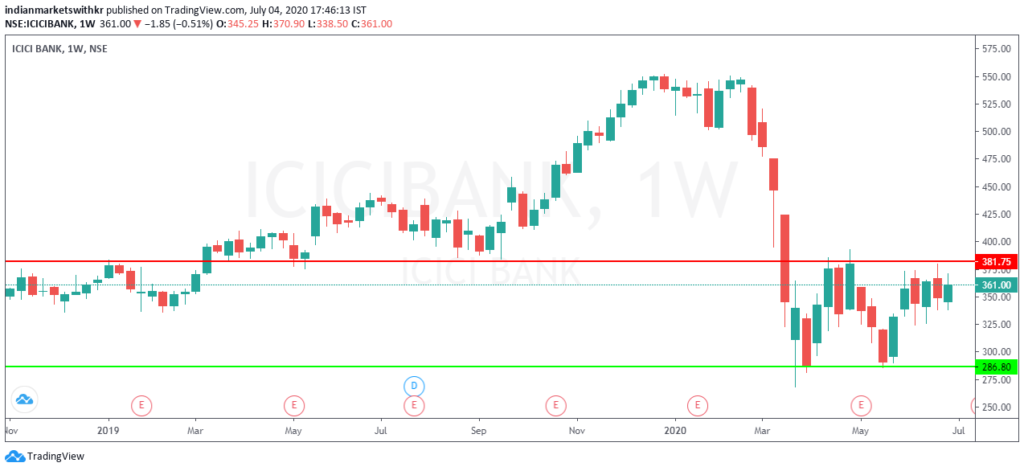
5. ICICI Bank (5.25%): ICICI Bank seems to be one of the weakest stocks in the list. It has been unable to break out of the range that it has been stuck in since the price fell during the initial few days of the COVID-19 outbreak. This is unlike many other stocks (especially large caps) that have managed to recover a fair bit from their swing lows. The daily chart (not pictured here) indicates a reasonable amount of resistance near the upper bound of the range. A strong sign of bullishness would be a close above 381 which may be a long shot but might just be possible (in the coming weeks at least) given that the RSI is above 40 and turning up.
Volatility:
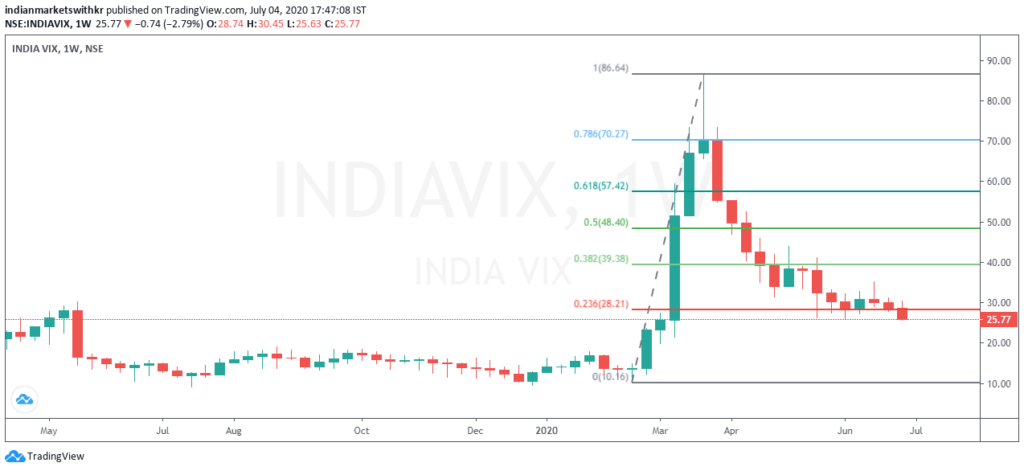
Perhaps the most surprising chart this time around is of INDIA VIX. This is because it has managed to breach the important support level at around 28. This is a very confidence-inspiring sign and may indicate favourable movements ahead. However, please consider that VIX does not move solely based on the chart’s support and resistances. Hence, keeping in mind that uncertainty still exists, it would not be appropriate to decisively conclude that VIX is stabilizing.
For your reference, a lower VIX (or lower volatility) is generally associated with price moves that are less choppier and more trending. It also results in lower option prices (due to a lower IV). But at the same time, the ATR (Average True Range) of the stock would be narrower.
Disclaimer:
We, Anosh Mody & Krunal Rindani shall take no responsibility for any losses occurring out of investment/trading decisions you make based on the contents of this article.
We are not SEBI registered investment advisors. This article is meant for educational purposes only, please consult your investment advisor before acting upon any information you see here.
We may or may not have open positions, kindly assume that we are biased.


