Market Chronicles for the week ended 18th December, 2020.
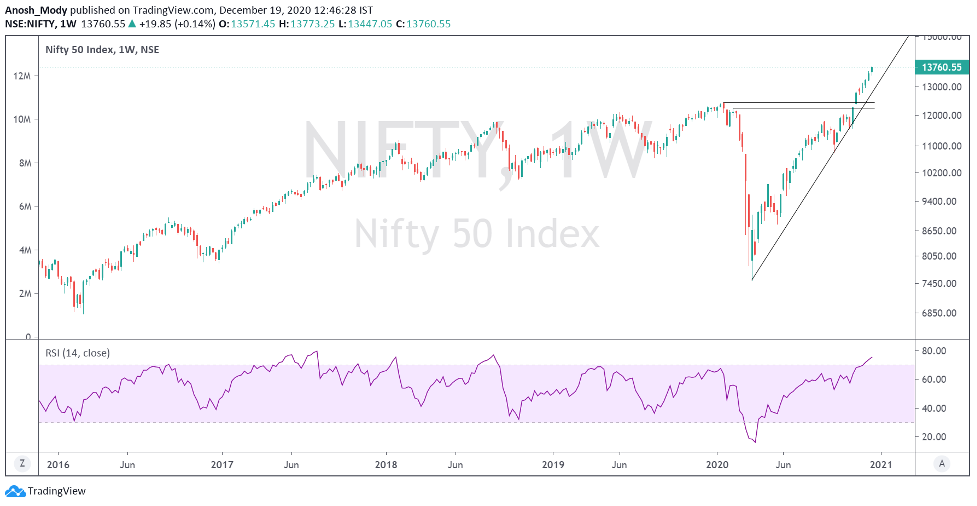
Nifty ended the second week of December 1.83% in the green. Even as naysayers called a top on every rally, supply was absorbed, and stocks performed decently well this week.
We maintain that even though the markets are extended, we are in a firm uptrend, and we remain BULLISH going forward. Any dips should be considered buying opportunities.
If you’re new to technical analysis and would like to know how to read the charts below, here’s a quick guide! https://www.investopedia.com/trading/candlestick-charting-what-is-it/
Big Boys
So far in December, FIIs have net bought 38734 cr of stock, while DIIs have net sold 29651 cr of stock


Source: StockEdge
Please read on to understand our rationale. This article contains an analysis of technical parameters as well as open interest and derivatives data. All the information below has hints for what levels to watch out for in weekly trade. Replicating these on your charting software and keeping an eye on them can help minimize unpleasant shocks in your trading.
Note: Our directional views are subject to sudden and drastic change mid-week. For anyone who wants a daily update on the stock markets, we suggest you follow us on Twitter, for some more frequent insights. Our handles are @anoshmodyy and @MarketsWithKR
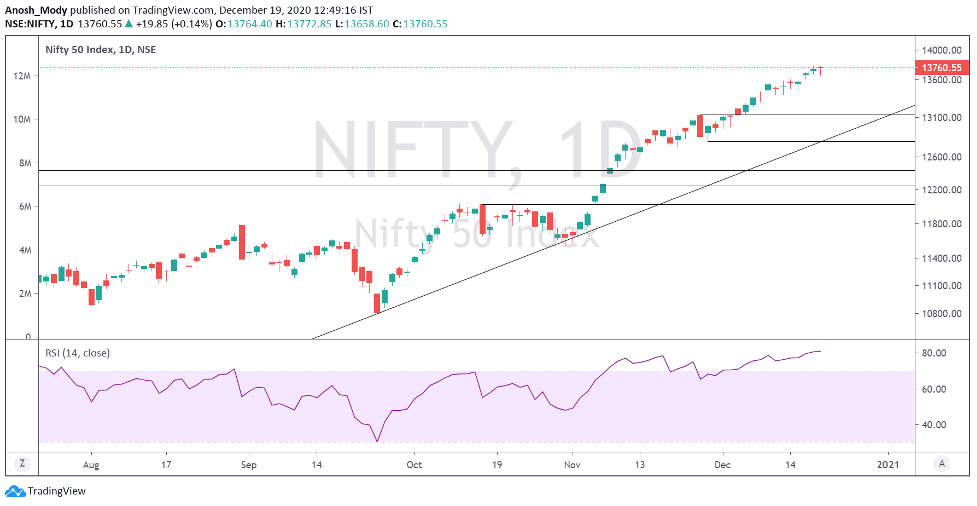
The daily chart has some key support levels marked, to watch out for in case of a deeper correction. We cannot rule out the possibility of a retest of the pre-COVID high, and that remains an important belt to watch in case the market crashes
Moving Averages
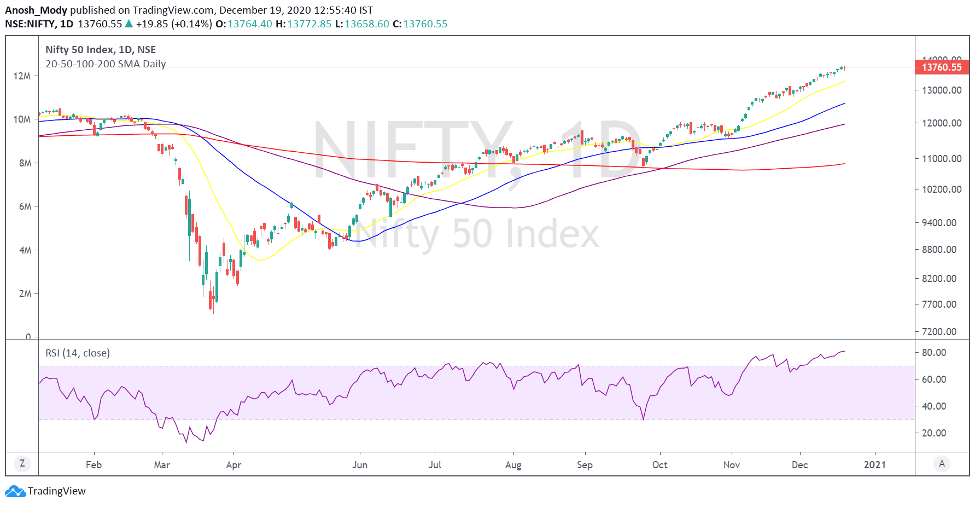
A quick snapshot of how the major Moving Averages are placed on the daily chart.
(Red = 200 MA; Purple = 100 MA; Blue = 50 MA, Yellow = 20 MA)
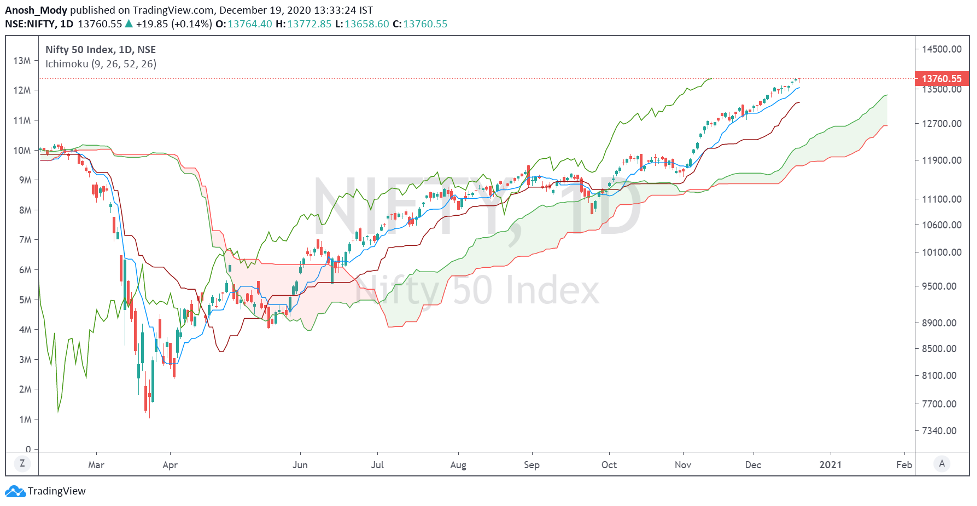
Ichimoku (D)
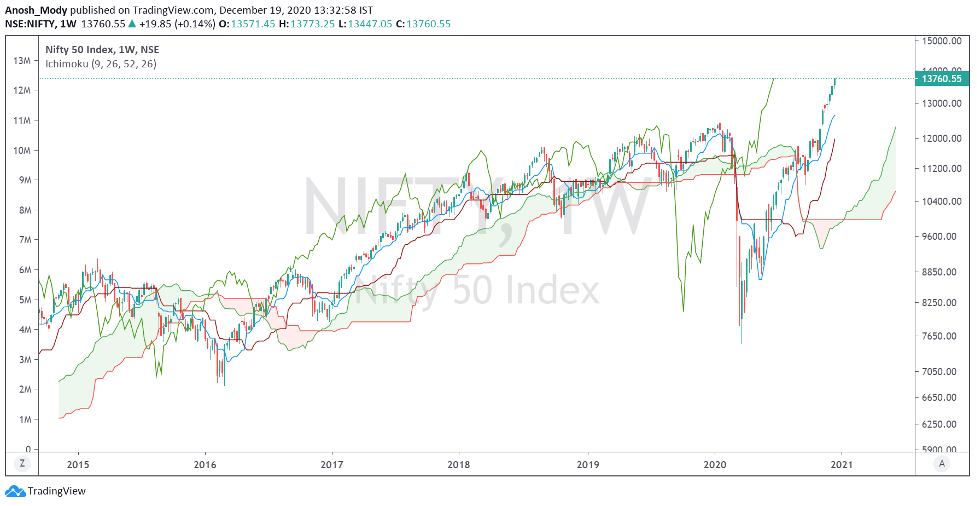
Ichimoku (W)
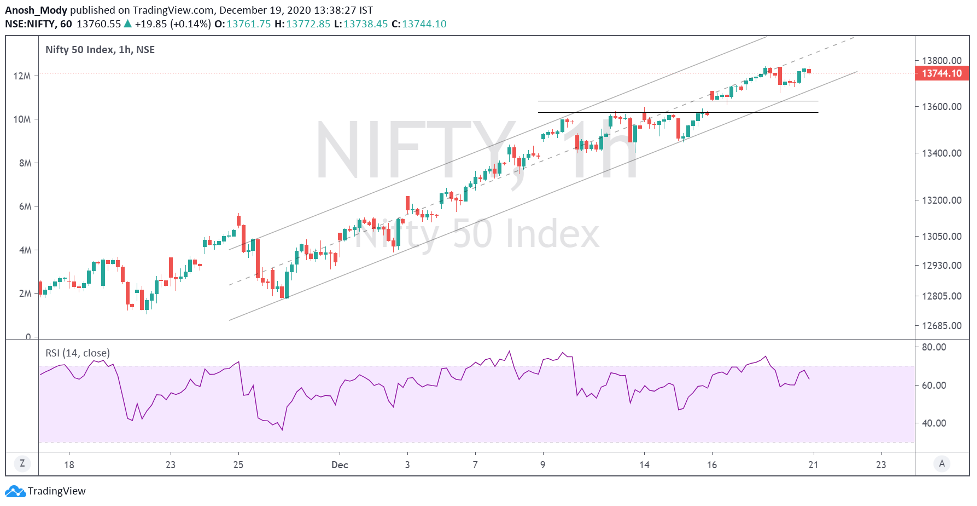
Nifty Intraday
The index has formed a rising channel, with a large open gap 13575 to 13625
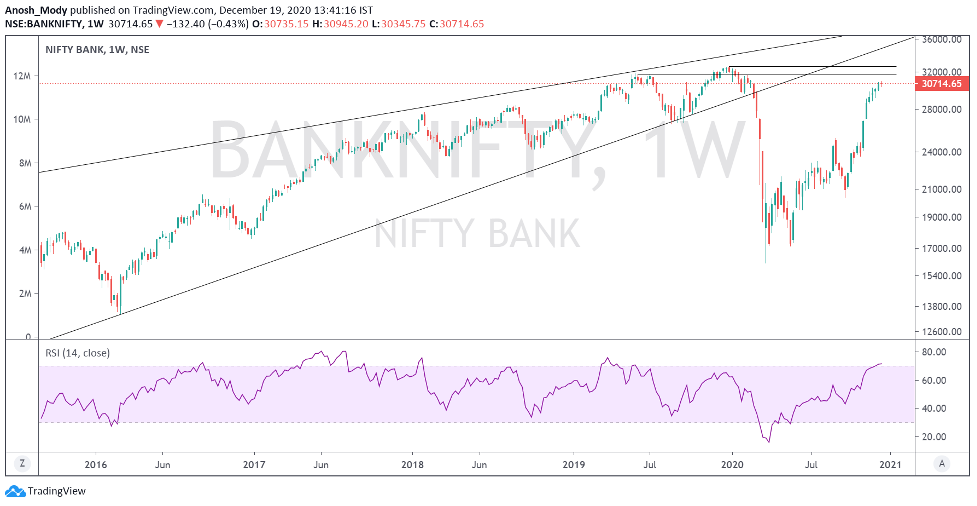
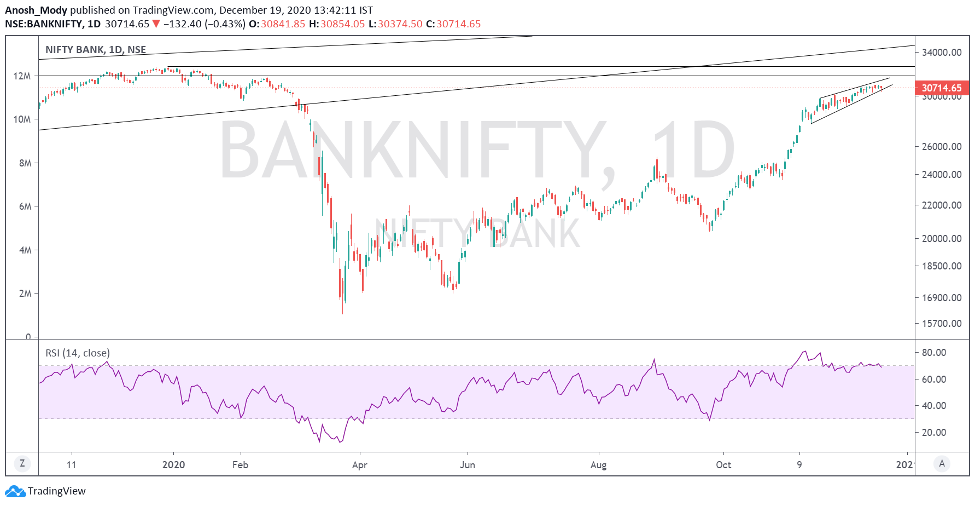
Bank Nifty
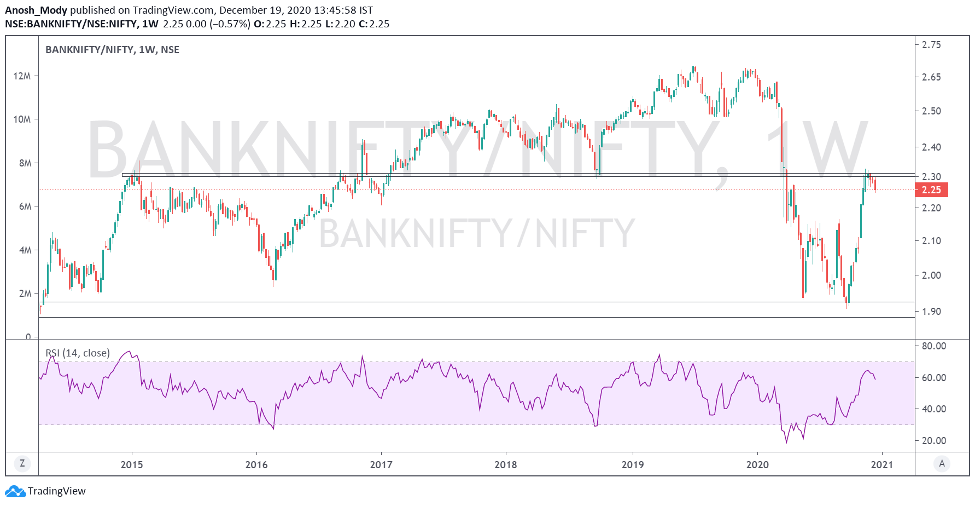
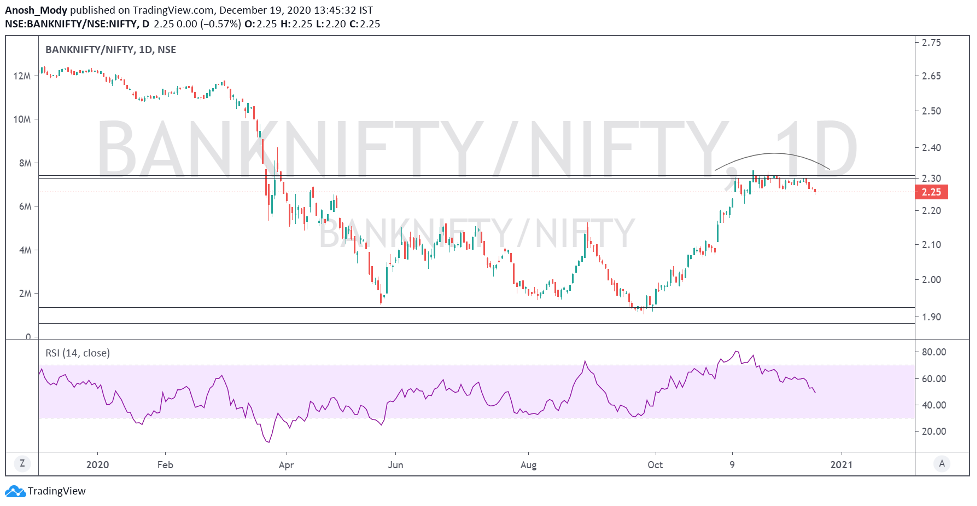
The bank Index remained soft this week, as it inches closer to a fresh ATH (now just 6.3% away). However, the RS chart shown below is showing some cause for caution
Bank Nifty vs Nifty (Relative Strength Chart)
The weekly relative strength chart turned away from resistance at a crucial CIP level!
The daily RS chart has formed a top of sorts and seems to be resolving lower. This could mark a short term pause in the Bank Nifty rally. Negated if the ratio chart crosses above the crucial CIP zone marked on the chart
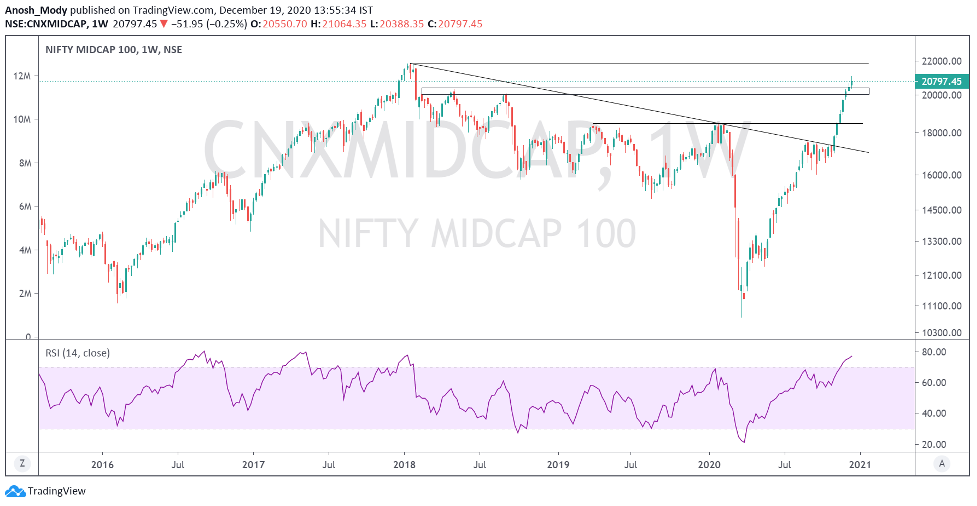
Nifty Midcap 100
The midcap index kept up its ferocious rally, and is now just 5% away from a fresh ATH.
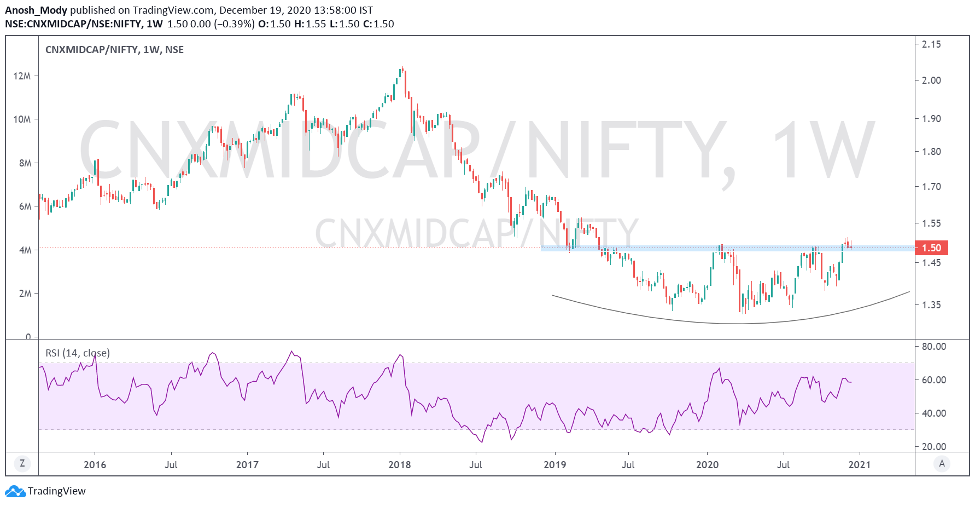
Nifty Midcap 100 vs Nifty 50
Midcaps are breaking out relative to Nifty50, and saw a retest of the flat top this week.
If the blue zone marked on the chart is held, we could see a fresh round of major outperformance by the midcaps!
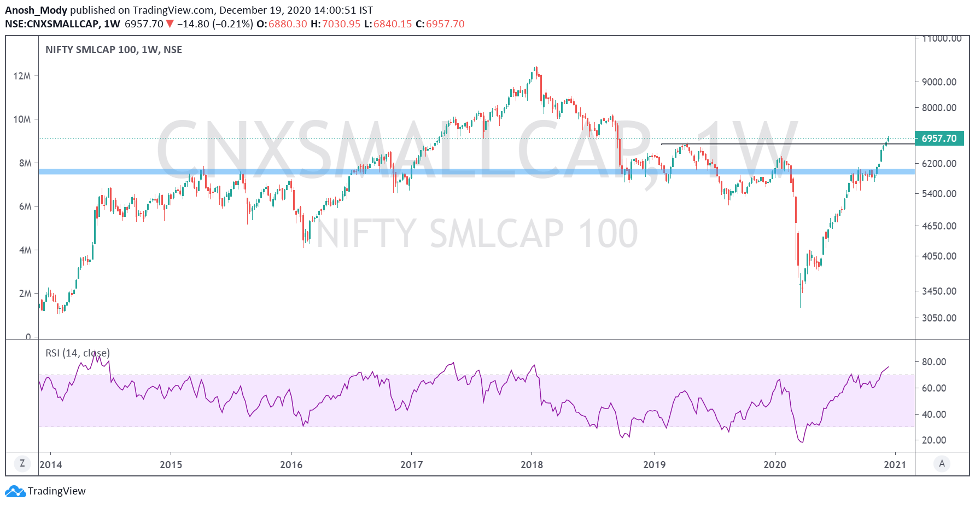
Nifty SmallCap 100
The smallcaps seem to have more catchup potential compared to midcaps, as they are still 38% away from their 2018 highs.
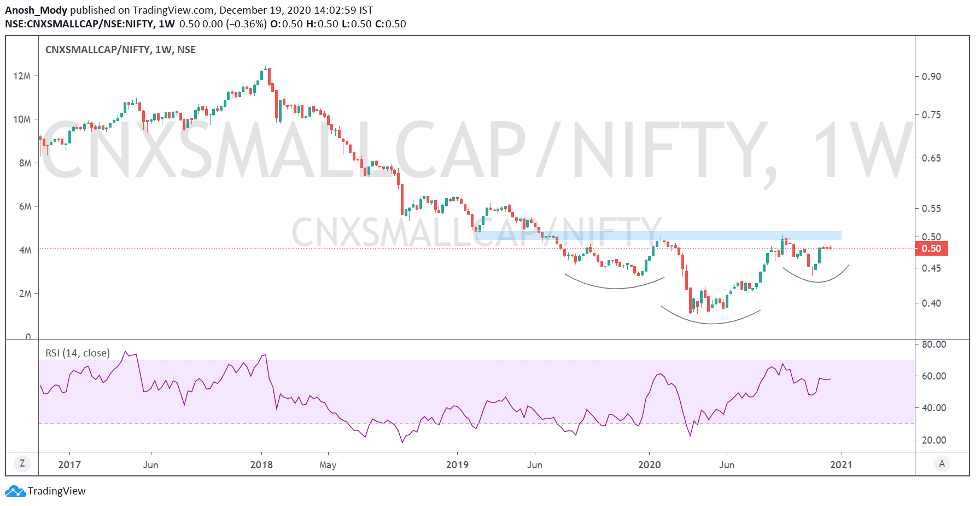
Nifty Smallcap 100 vs Nifty 50
The ratio is forming an inverted H&S pattern with neckline as the CIP level marked in blue on the chart. Breakout above this can show good outperformance by smallcaps.
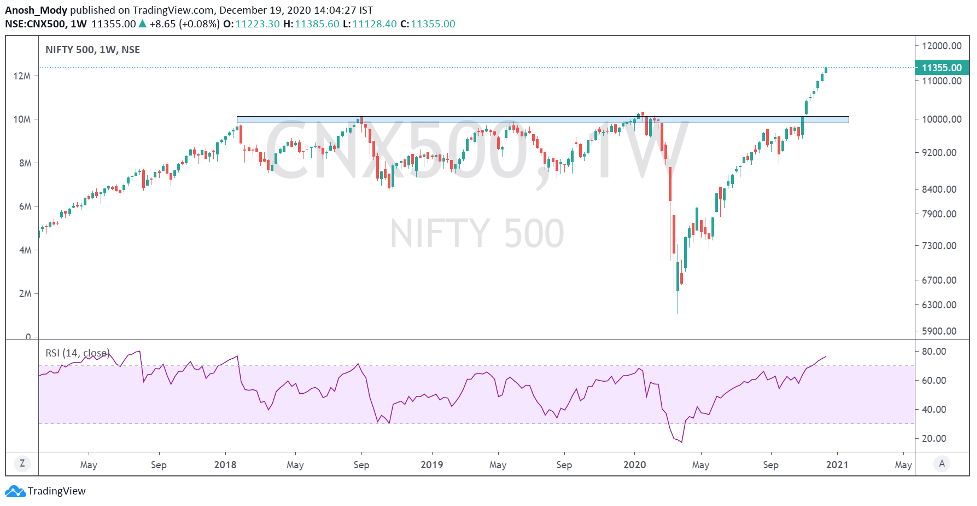
Nifty 500
The broad market measure of Indian stocks also did very well this week, and this lends more faith in this rally. The index does look extended, but no sign of a top is immediately visible.
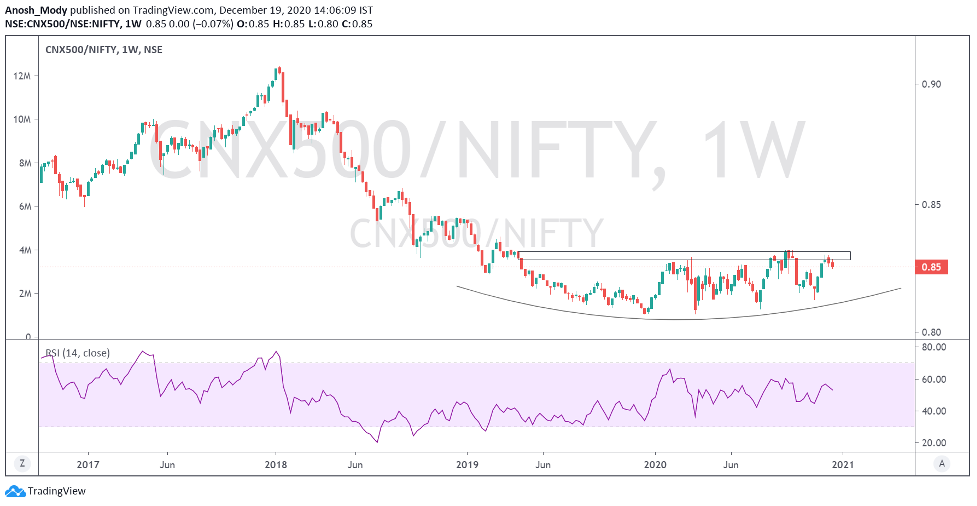
Nifty 500 vs Nifty 50
The RS chart is turning lower from the flat top. Breakout above that will see good outperformance by the broadmarket
Currency
DXY
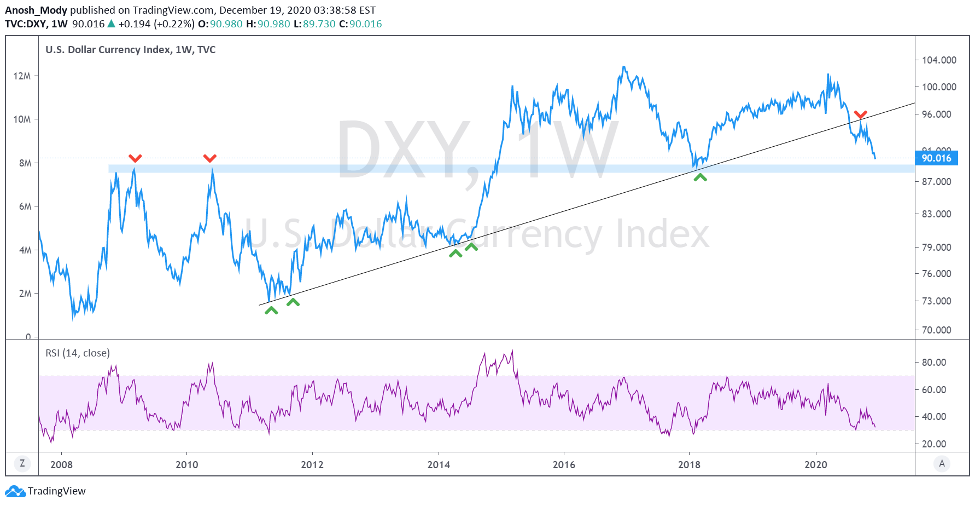
As anticipated, the DXY continues to move lower after breaking down the support level of 92. This is overall quite positive for global equities. However, it may find support in the CIP level of 88-89
USDINR
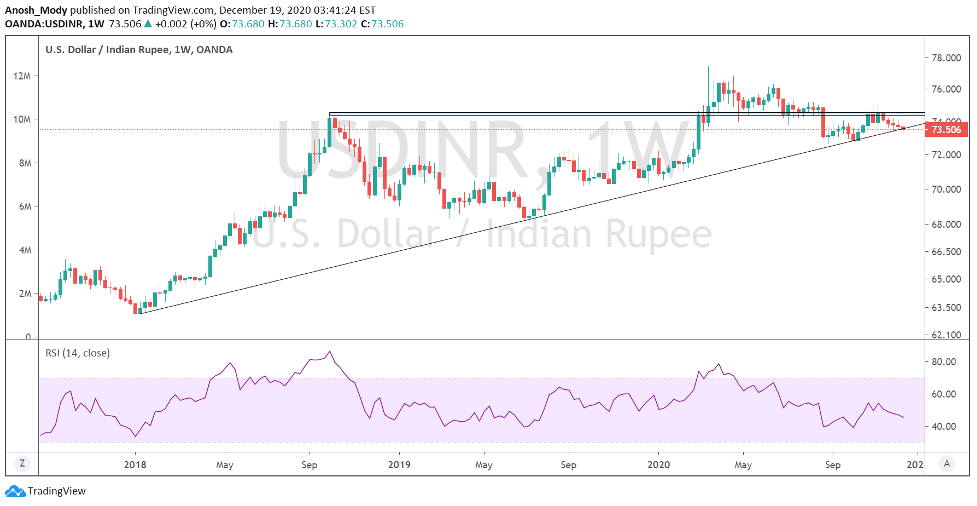
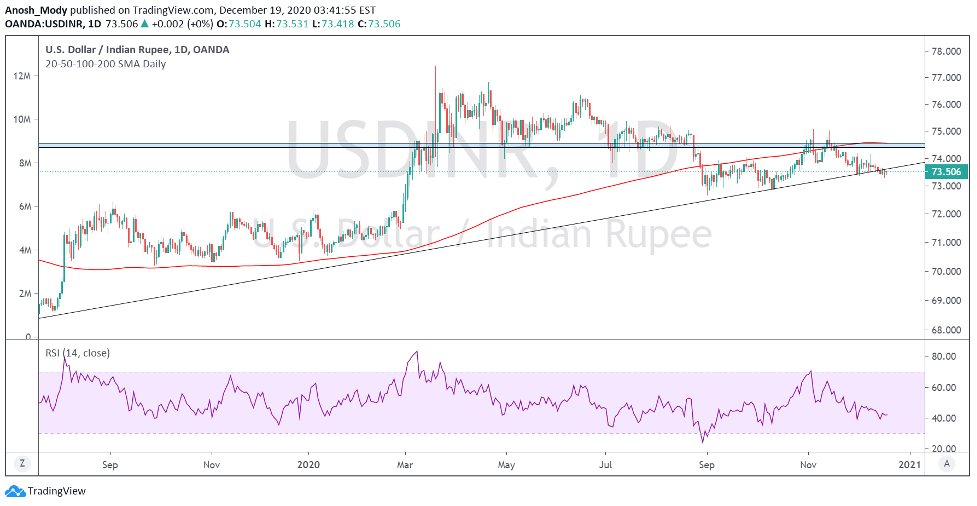
The currency pair found support on the long term trendline and if the breakdown doesn’t happen soon, the major resistance level of 74.40-74.50 can be tested again
OI Analysis 6
Open interest or OI is the total number of open positions in the market. A high OI indicates that there is a lot of activity in that instrument. It does not indicate buyers and sellers individually but is instead a more holistic measure, i.e. it is the number of contracts between the buyers and sellers, not the buyers and sellers on their own. One of the ways OI analysis works is that high-volume market participants would have sold strangles at strikes which leads to higher OI. This type of reading does not typically account for other types of spreads that one may trade, but the data for it is available.
Nifty
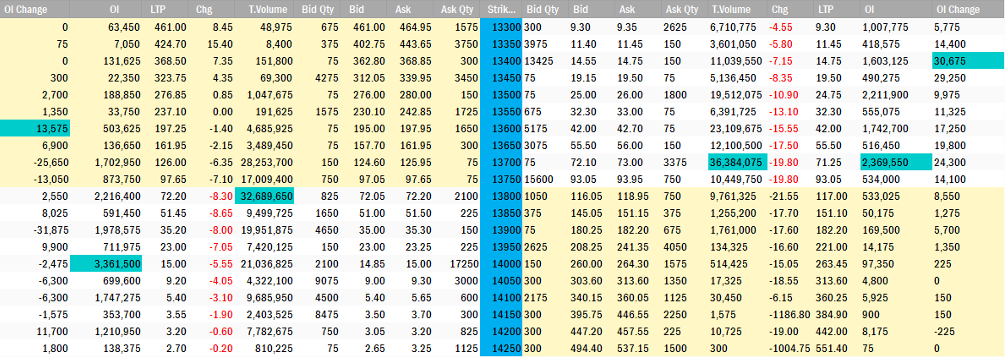
After setting at 13,500 for several days last week, the highest put OI has consistently been around 13,700 which may indicate a very strong support at that level. In fact, on Friday the market corrected sharply in the first half and breached 13,700 yet put writers remained active at that level which shows that many consider that as a high-conviction support level.
The highest call OI remains to be at 14,000 which is an important psychological level. By many estimates, 14,050-14,150 may be the possible range for the coming week, but the picture should become clearer once the market opens and sentiment is known next week.
Bank Nifty
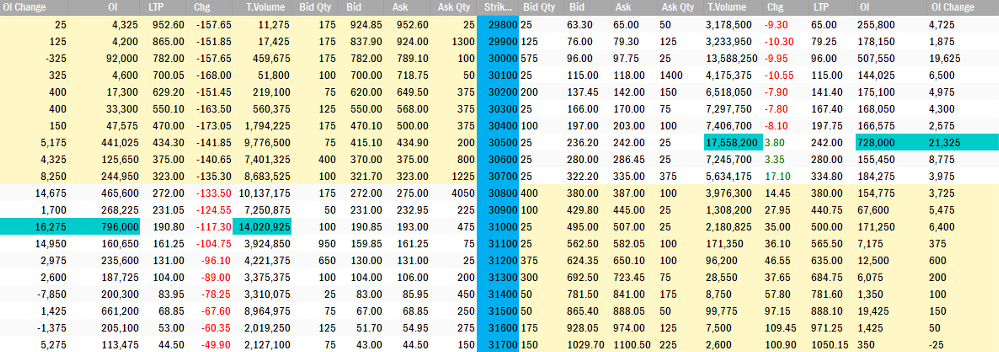
Highest call OI for Banknifty remains at 31k, a level it has failed to breach since the past several sessions. In fact, despite BN being more than 6% away from ATH, it has underperformed Nifty since the past three weeks. However, looking at how importantly-placed some banking stocks are, it may be likely that Banknifty breaches the 31k mark, in which case the call OI may be rolled over to something higher. Highest put OI has remained at 30,500 despite several attempts to breach that level which indicates that the index may have formed a strong support at that level.
Heavyweights in the Nifty 50:
Let’s look at some important stocks in Nifty50 that collectively make up around 42.66% of NSE’s flagship broad market index. This figure is lower than last month’s which means that the weightage occupied by the top five stocks has reduced. Another significant change is that Reliance Industries has lost its top spot to HDFC Bank and TCS has exited the Top 5, making way for ICICI Bank.
On the chart front, we’ve used naked charts, for the most part, to display the price action better.
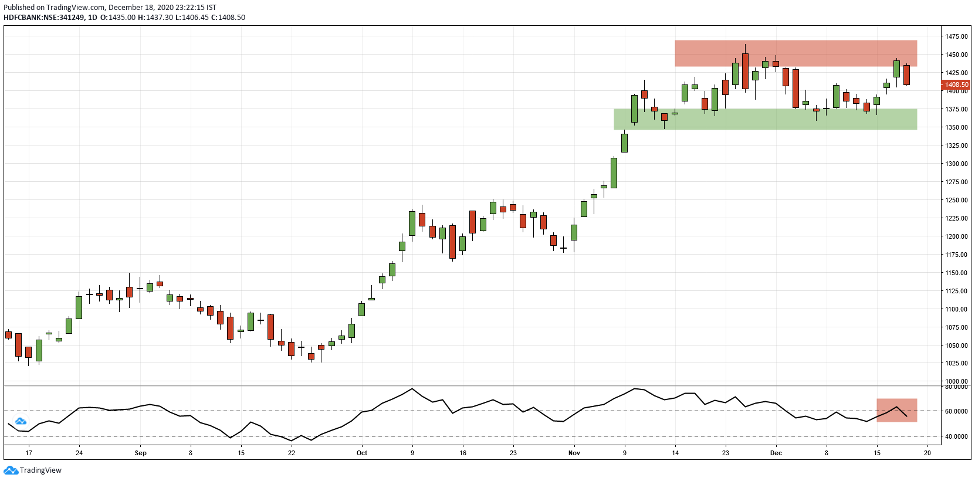
1. HDFC Bank (11.21% weight): The stock managed to recover well from its lows after facing some selling pressure post the RBI order on digital services. However, it hasn’t managed to gather momentum yet and is consolidating between the red and green zones. RSI, a measure of momentum and ‘strength’ has slipped below 60, indicating that the stock is losing steam. However, given that it’s so close to support, HDFC Bank may well bounce up soon. (Read the Basics of Dow Theory and trend by clicking here).
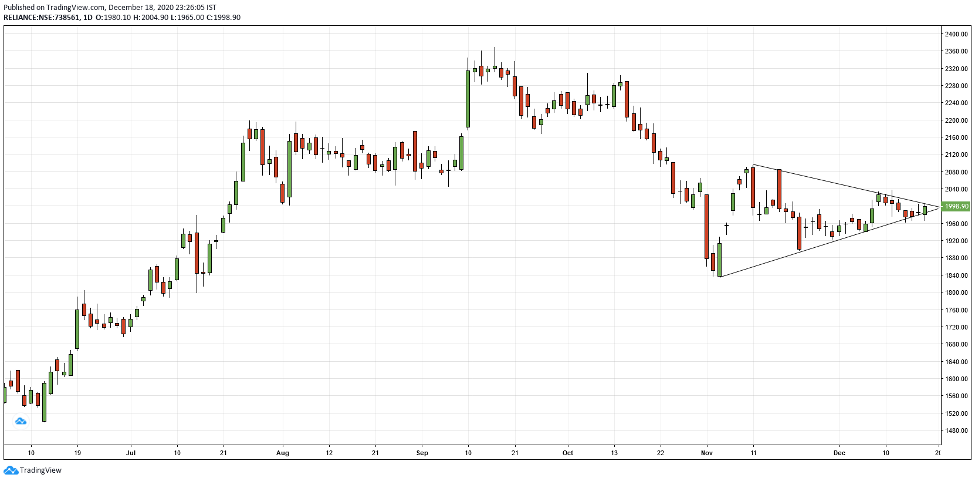
- Reliance Industries (11.17% weight): Reliance has an important Monday ahead. Not only has it formed a triangle, but there’s also a news-based trigger for the stock. This may just be the fuel that the stock required to breach the strong 2,000 psychological resistance. Despite the seemingly positive cues, it’s best to be cautious as the stock can show very choppy moves until its comfortably above 2,000-2,050.
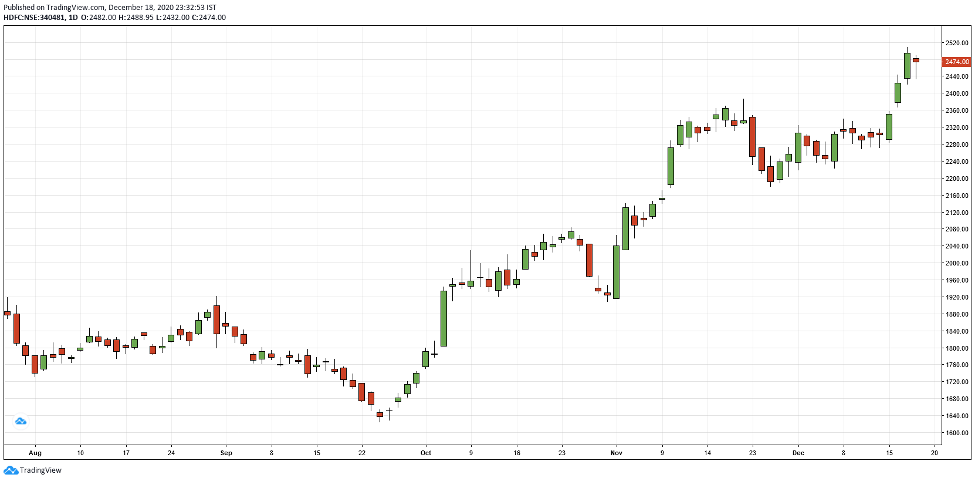
- HDFC (7.23% weight): HDFC has created an ATH by attempting >2,500 levels for a little bit. While the stock did come down on Friday, the long lower wick indicates that there’s sufficient demand at lower levels and that bulls remain in control, at least for now. It will be important for the stock to trade at ATH otherwise it may move sideways, just like its banking counterpart.
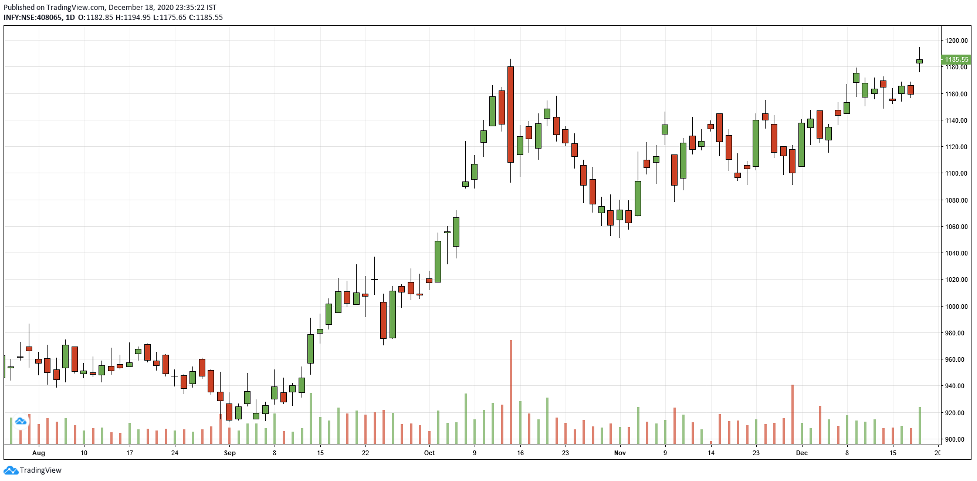
- Infosys (7.21% weight): While the stock made a new high on Friday, it’s formed a spinning top with high volumes on Friday. In the past, this has been a reversal sign. Which means that unless IT as a sector can become strong or Infy sees an important news-based trigger, it might not make a very large move. And if bulls are unable to keep prices high, the very short-term trend may change, in which case the stock may fill in the gap and come back to 1,160 levels. In the past, we can see that spinning tops haven’t changed the broad trend, but have led to smaller corrections in price.
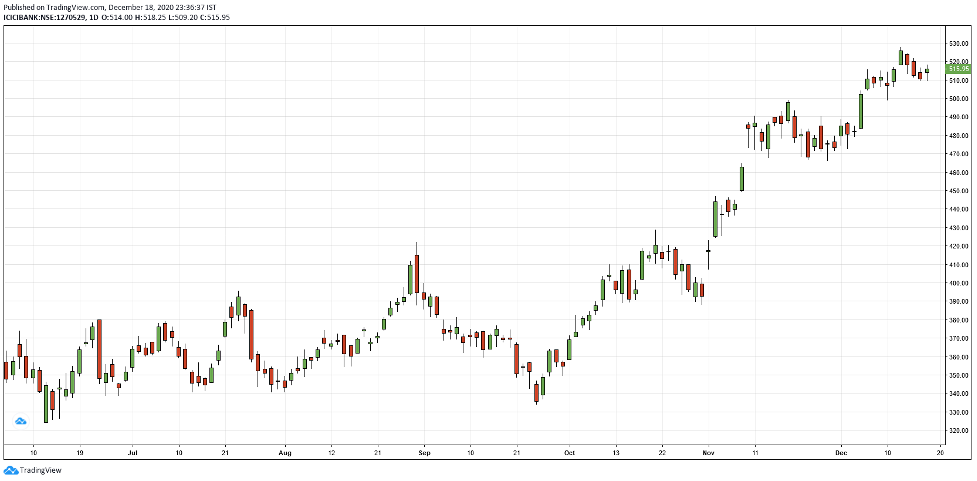
- ICICI Bank (5.84%): After breaking out of the consolidation, ICICI Bank retested that level (510) and showed good strength on Friday. If the stock trades above Friday’s high on Monday, it may show that bulls are quite strong and very active. It seems to have accepted 500+ levels for now.
Heavyweights in Banknifty:
The number one mover is HDFC Bank, which has already been spoken about in the previous section, so we will discuss two other important stocks here, namely Kotak Bank and SBI. Other banks have an impact on the index, but these along with ICICI Bank are typically the movers.
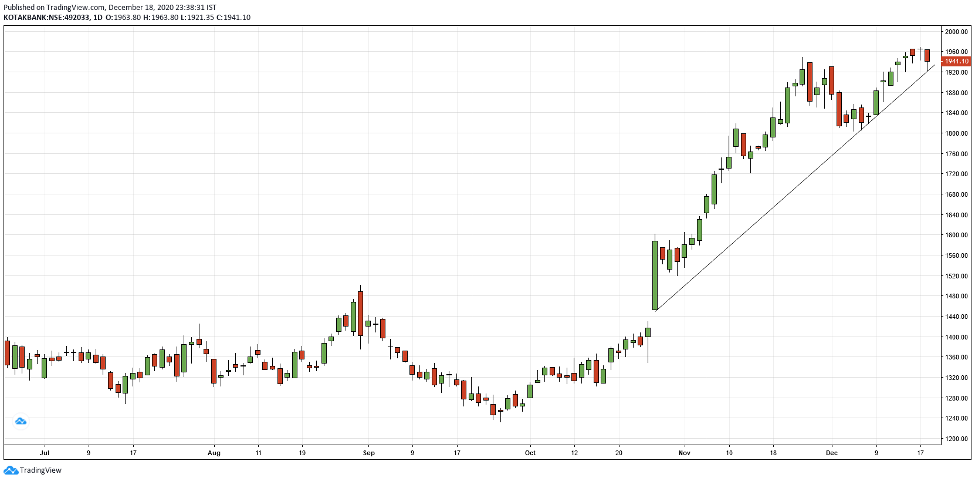
- Kotak Bank: Drawing a very steep trendline, we can see that Kotak Bank is at an interesting support if it wants to retain the strong bullish trend. The longer lower wick also shows good recovery from the day’s lows.
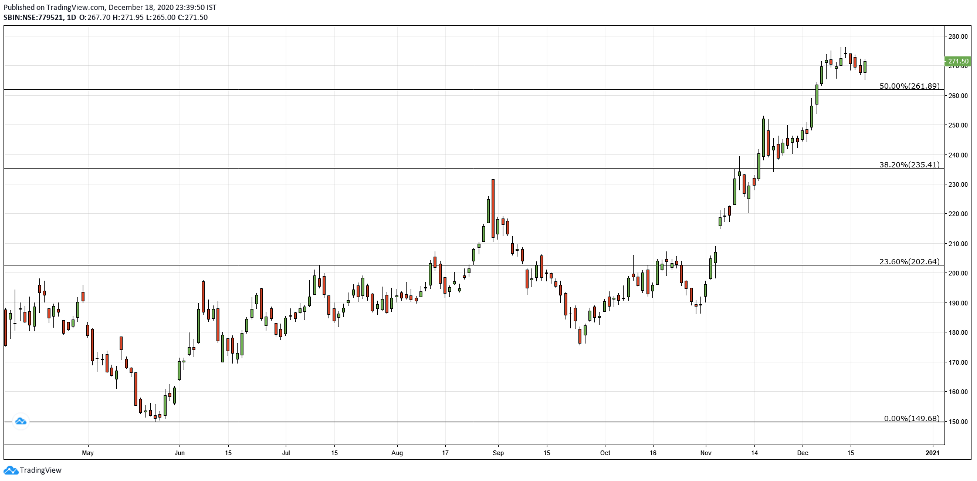
2. SBIN: SBI saw a rough few days at the start of the past week, but later caught up with a very strong candle on Friday. PSU banks in general underperformed this past week, so SBIN’s sideways performance is possibly not due to the stock’s inherent qualities. Based on the FIB retracements (drawn from ATH to COVID swing low), we can see that as long as the stock maintains above 261, it should continue the bullish trend it’s been in
Volatility:
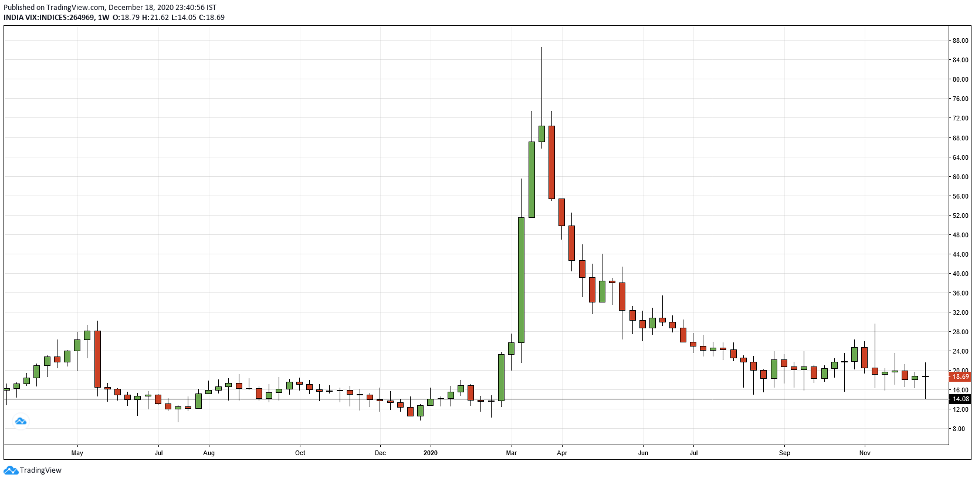
VIX has formed an important candle for the weekly close. For starters, the low for this week was the lowest since pre-covid levels! It’s also managed to close below 20, an important sign. But despite this, prices intraday continue to be quite choppy.
Also, many “expect” a correction very soon. If that’s the case, it may be interesting to see how VIX reacts.
For your reference, a lower VIX (or lower volatility) is generally associated with price moves that are less choppier and more trending. It also results in lower option prices (due to a lower IV). But at the same time, the ATR (Average True Range) [https://www.investopedia.com/articles/trading/08/average-true-range.asp] of the stock would be narrower.
Moving Averages decoded: https://www.investopedia.com/terms/m/movingaverage.asp 1
Demystifying the art of Fibonacci Retracements: https://www.investopedia.com/terms/f/fibonacciretracement.asp 2
The basics of Dow Theory: https://www.investopedia.com/terms/d/dowtheory.asp 3
What are trendlines?: https://www.investopedia.com/terms/t/trendline.asp 4
Gaps made easy: https://www.investopedia.com/terms/g/gap.asp 5
Open interest explained: https://www.investopedia.com/terms/o/openinterest.asp 6
Disclaimer:
We, Anosh Mody & Krunal Rindani shall take no responsibility for any profit or losses occurring out of investment/trading decisions you make based on the contents of this article.
We are not SEBI registered investment advisors. This article is meant for educational purposes only, please consult your investment advisor before acting upon any information you see here.
We may or may not have open positions, kindly assume that we are biased.
Anosh Mody is an MBA student from SBM, NMIMS Mumbai. However, the views reflected in this article are strictly his own, and in no way reflect upon the B-School in any manner.
Follow Us @

