Market Chronicles for the week ended 28th November, 2020.
If you’re new to technical analysis and would like to know how to read the charts below, here’s a quick guide! https://www.investopedia.com/trading/candlestick-charting-what-is-it/
Nifty ended the month of November an unbelievable 11.4% in the green! Most of the gains were contributed by the first 2 weeks of trade. The last 2 weeks were full of turbulence, as is natural to expect near the 13000 mark on the Nifty!
We maintain that the markets are in a firm uptrend, and we remain BULLISH going forward, and any dips should be considered buying opportunities.
Please read on to understand our rationale. This article contains an analysis of technical parameters as well as open interest and derivatives data. All the information below has hints for what levels to watch out for in weekly trade. Replicating these on your charting software and keeping an eye on them can help minimize unpleasant shocks in your trading.
Note: Our directional views are subject to sudden and drastic change mid-week. For anyone who wants a daily update on the stock markets, we suggest you follow us on Twitter, for some more frequent insights. Our handles are @anoshmodyy and @MarketsWithKR
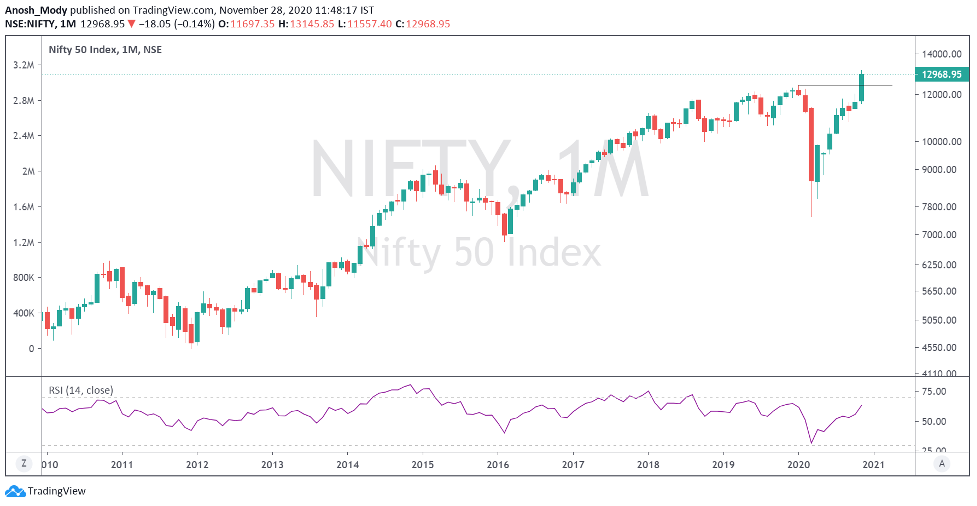
The monthly chart is very pleasing to look at, as Nifty broke out to a new all time high; a stark difference from the grim environment from March.
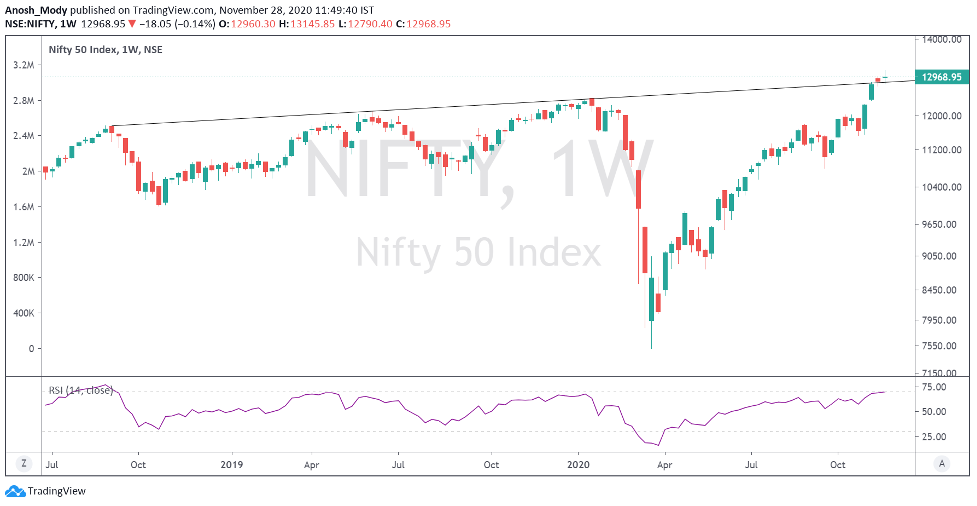
On the weekly chart, we see how the index decisively managed to close above the trendline joining the tops!
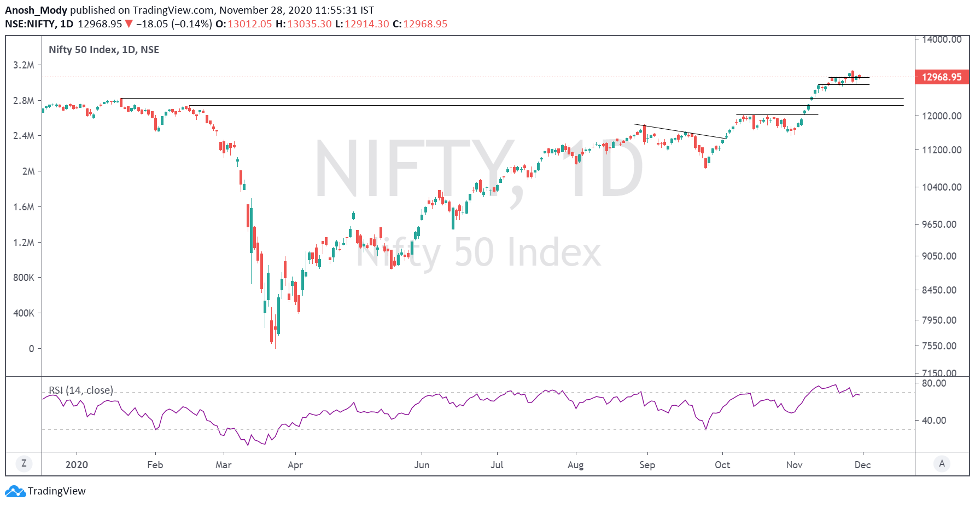
The daily chart has some key support levels marked, to watch out for in case of a deeper correction. We cannot rule out the possibility of a retest of the pre-COVID high, and that remains an important belt to watch during a correction
Big Boys
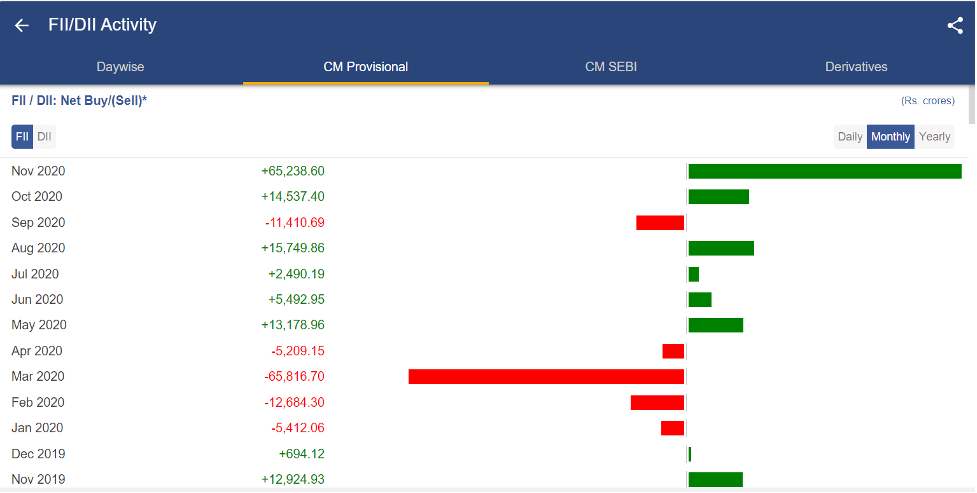
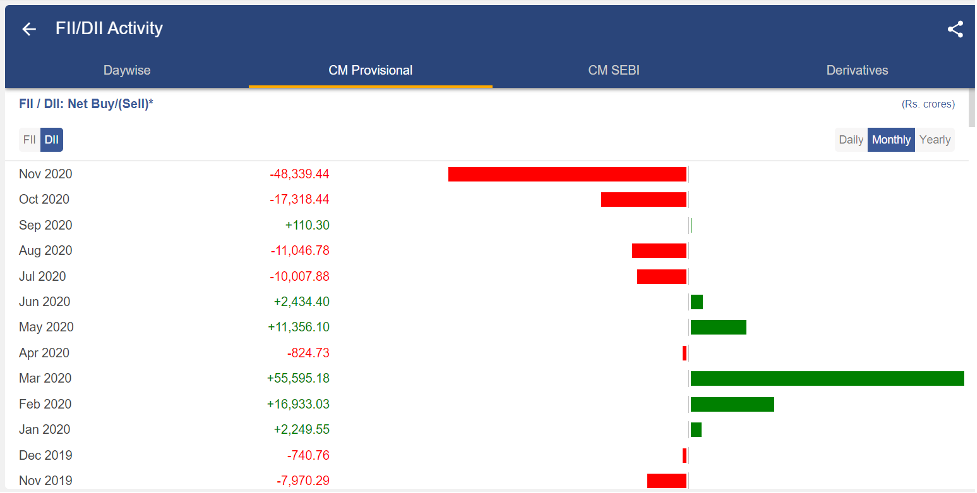
The big boys of the stock market, viz FIIs and DIIs exhibited some very interesting behaviour this month!
FIIs pumped in net Rs. ~65k cr into the markets, while DIIs dumped Rs. ~48kcr of stock, in stark contrast to March when FIIs dumped Rs. ~66k cr of stock, and DIIs pumped Rs. ~55k cr of stock
Moving Averages
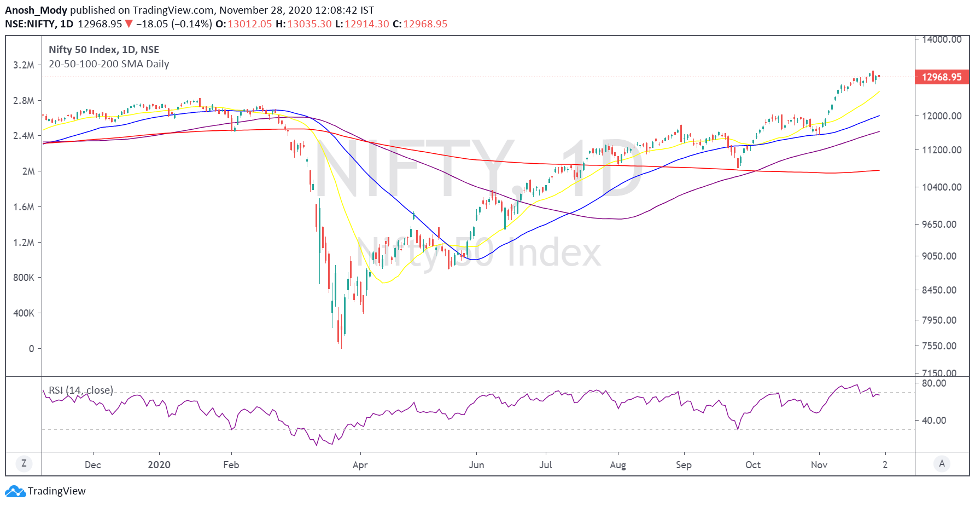
A quick snapshot of how the major Moving Averages are placed on the daily chart.
(Red = 200 MA; Purple = 100 MA; Blue = 50 MA, Yellow = 20 MA)
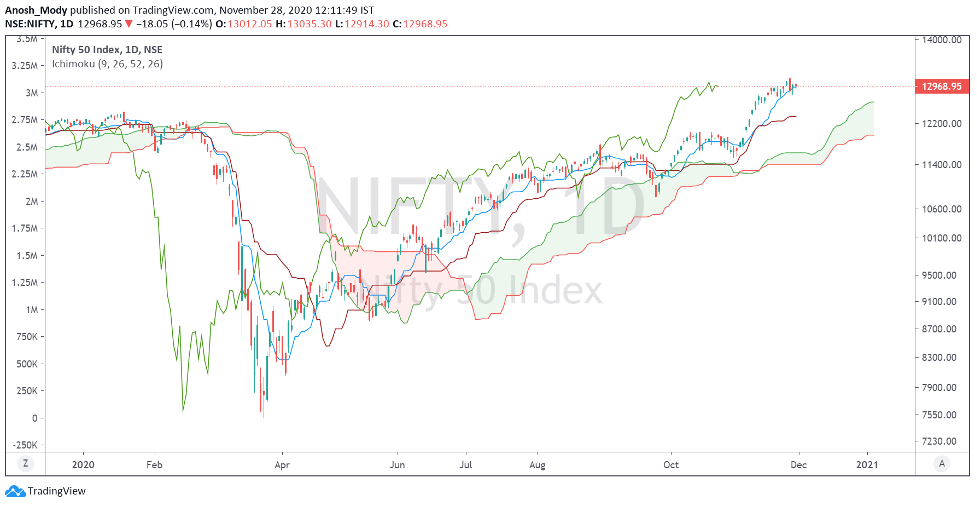
Ichimoku (D)
Ichimoku (W)
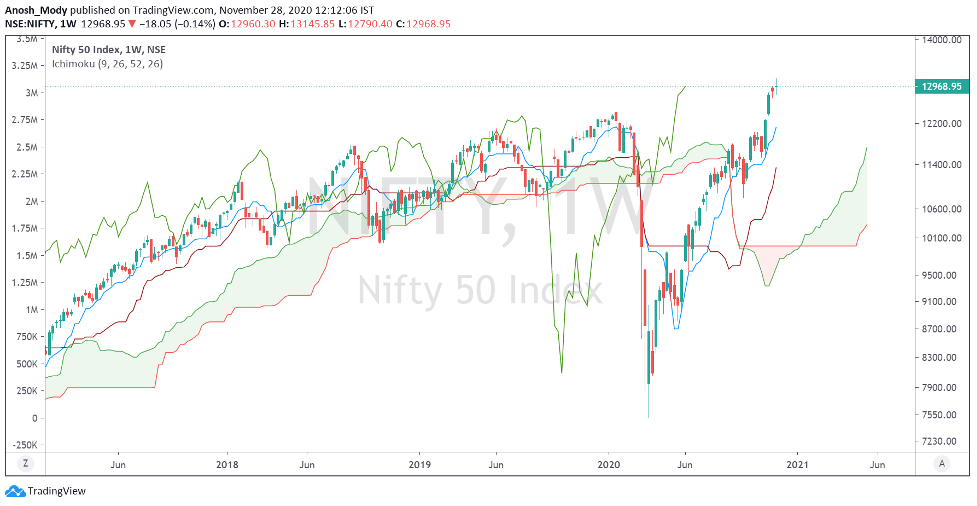
Ichimoku (M)
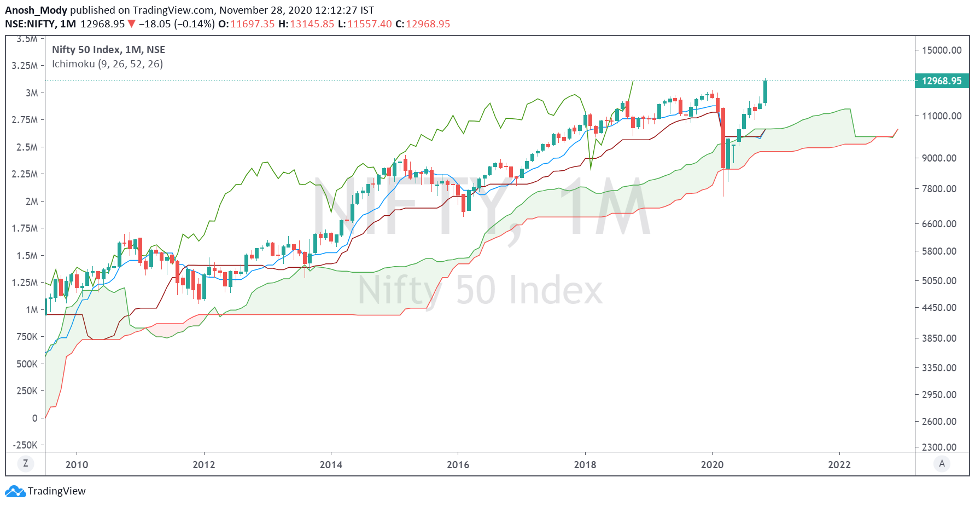
Nifty Intraday
Important levels remain as 12750, 12960, and 13150. Some open gaps to the downside also marked.
Bank Nifty
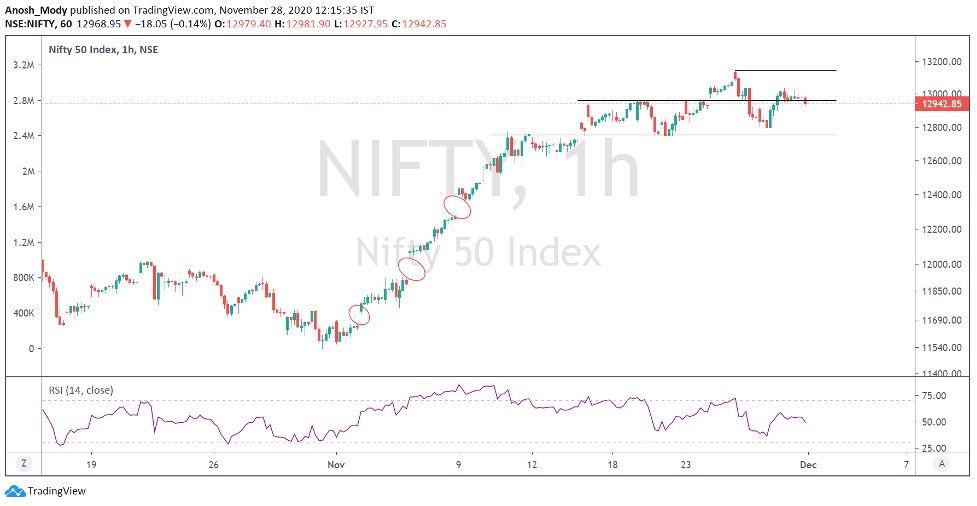
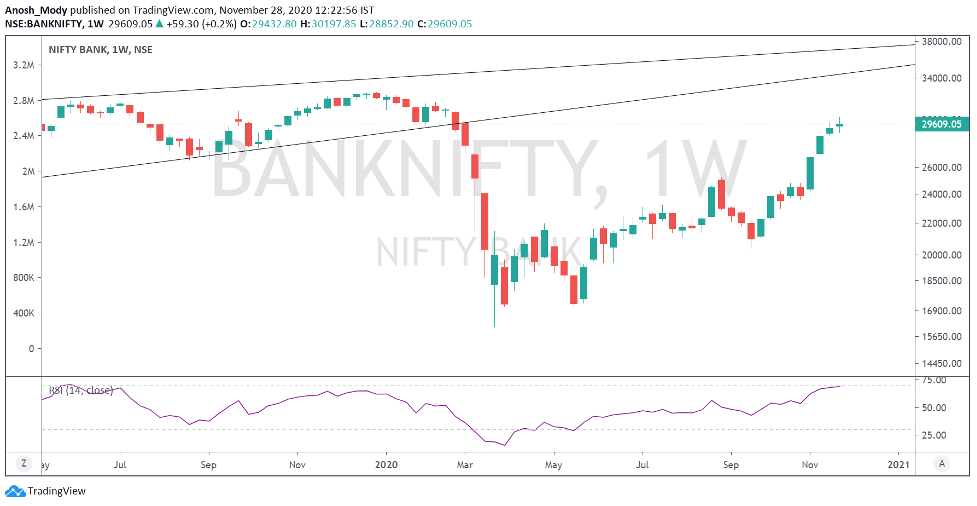
Bank Nifty had a phenomenal November, surging an amazing ~24%! The “sell financials buy healthcare” gang was handed a rude shock by the markets, as Bank Nifty outperformed Nifty Pharma by ~17% this month. However, Bank Nifty still hasn’t broken out to a new all time high
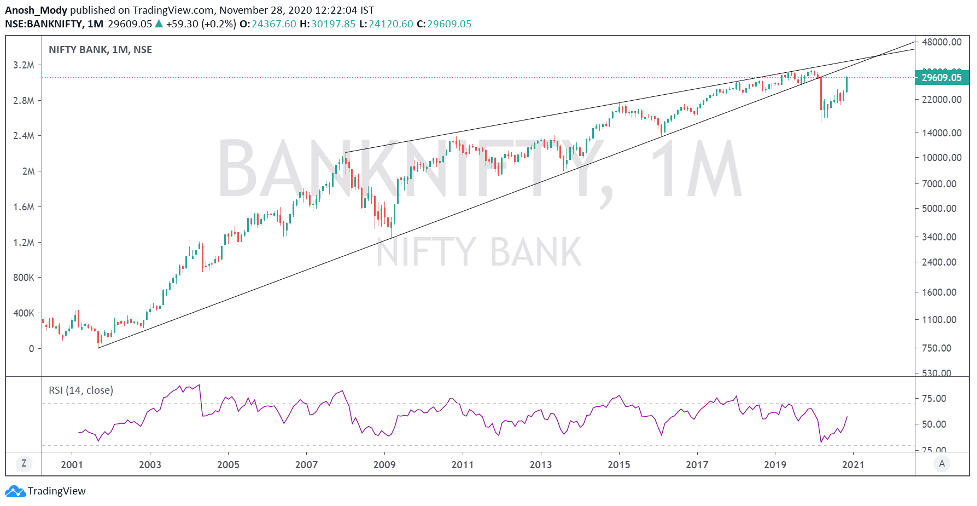
We are now just 9% away from a new ATH on bank Nifty
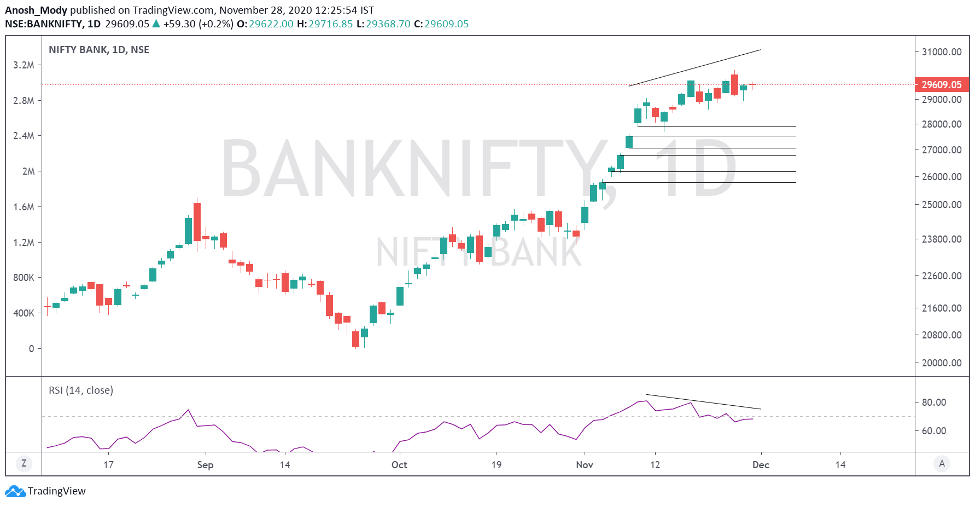
On the daily chart, we see a bearish RSI divergence, which makes us believe that a short term correction is due, after the index extended almost with a very steep incline.
Some key levels (open gaps) are marked
Follow Us @
Follow Us @
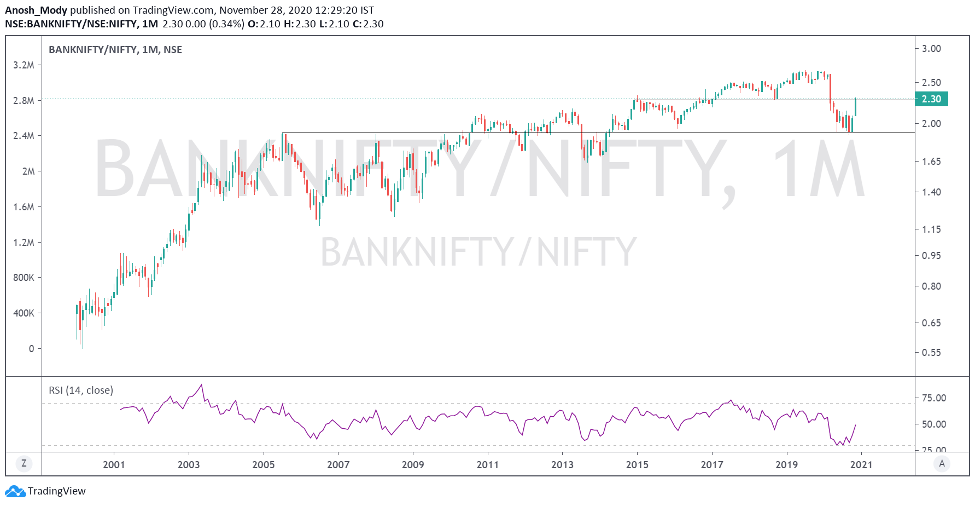
Bank Nifty / Nifty (Relative Strength Chart)
The monthly relative strength chart shows how Bank Nifty has massively outperformed in October and November
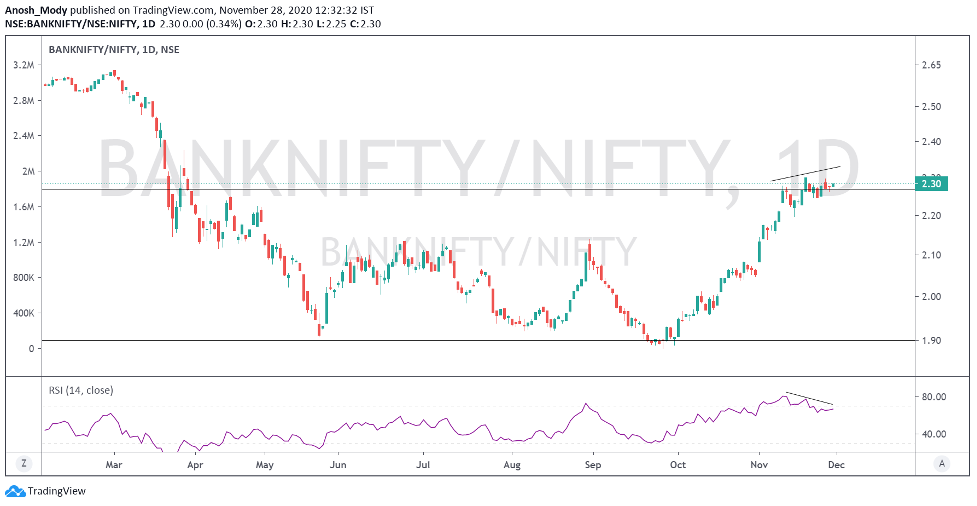
The daily chart shows that the ratio has formed a bearish RSI divergence near a historical CIP level. This adds to our belief that Bank Nifty can correct in the short term
Nifty Midcap 100
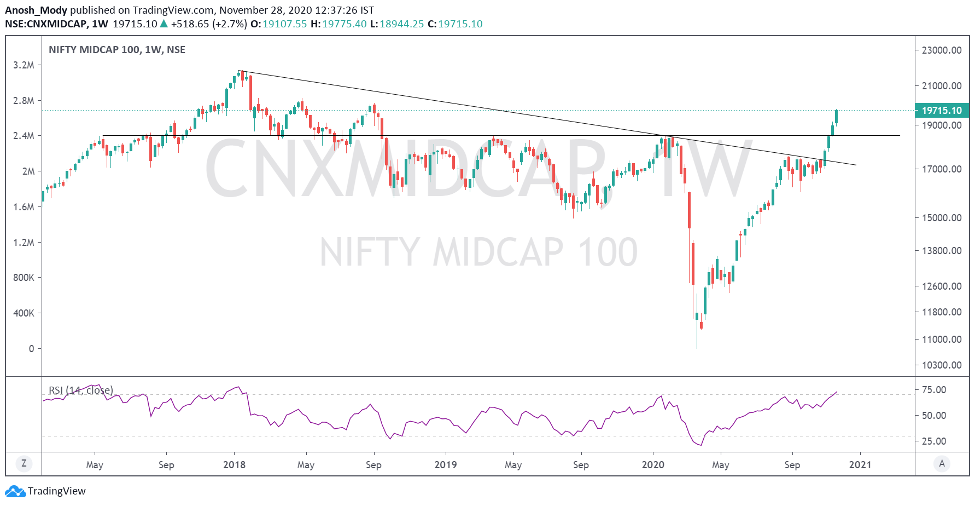
Midcaps have decidedly broken out, as this rally has been very secular, leaving very few behind. This is a very bullish development for Indian equities in the medium term
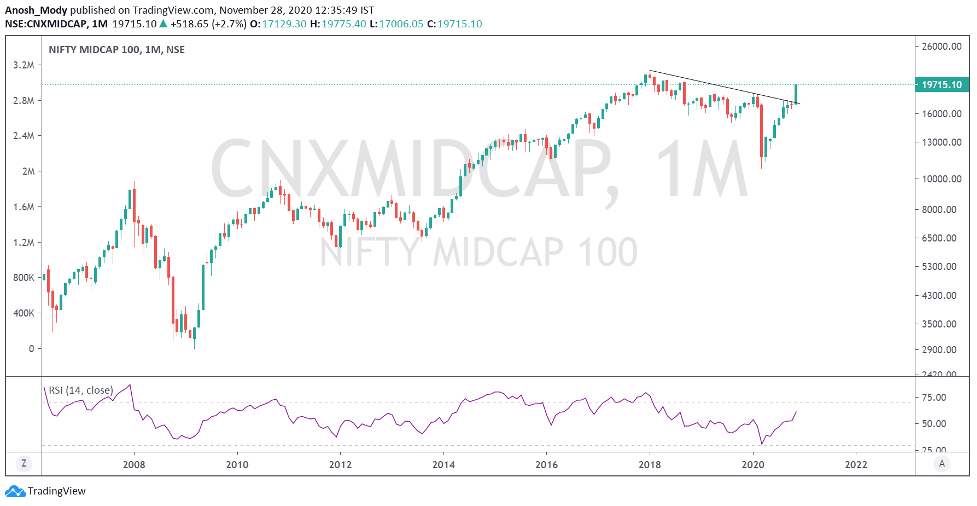
However, it is likely that the vertical rise of November is likely to be faced by some time or price correction.
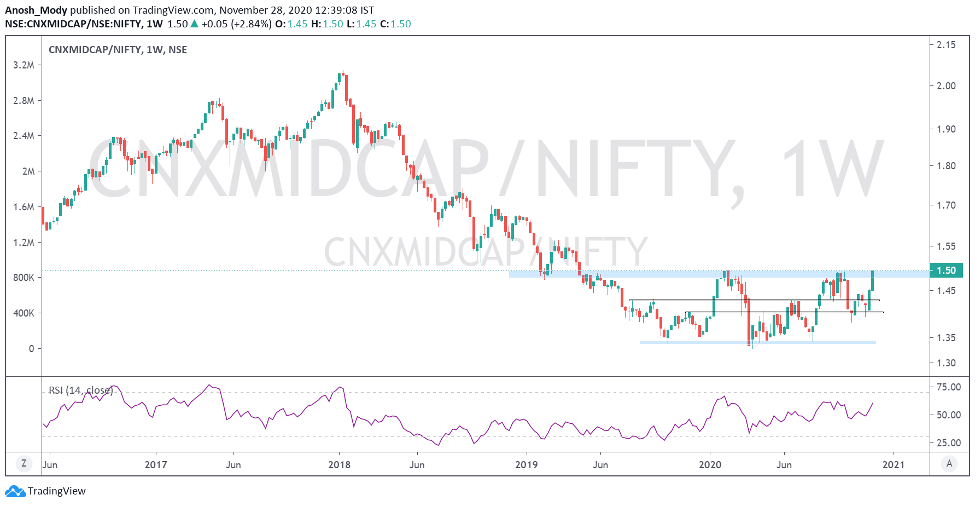
Nifty Midcap 100 vs Nifty 50
The ratio is at an important CIP level, and can face some resistance here. A decisive breakout above this level can show some serious outperformance by midcaps
Nifty SmallCap 100
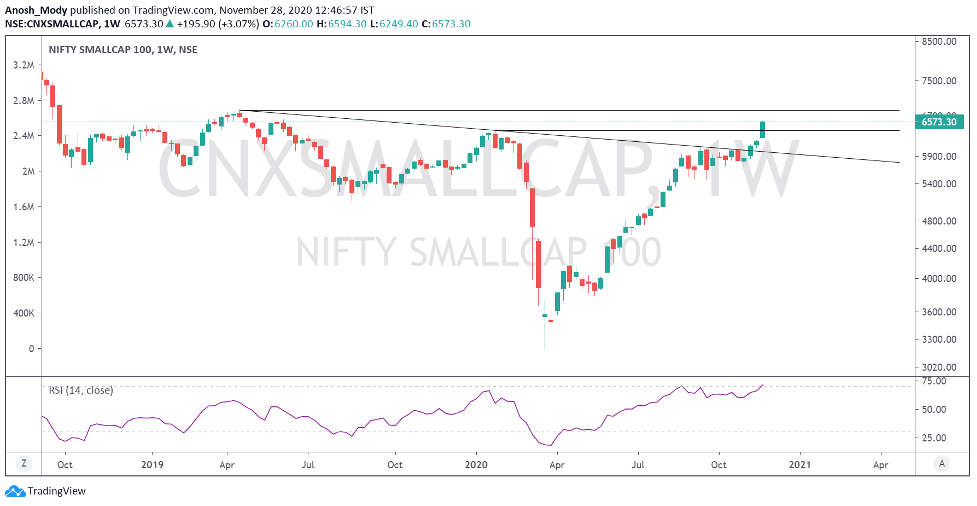
November has been very positive for small caps, as the smallcap index broke out of a very crucial level as well as a downward trendline
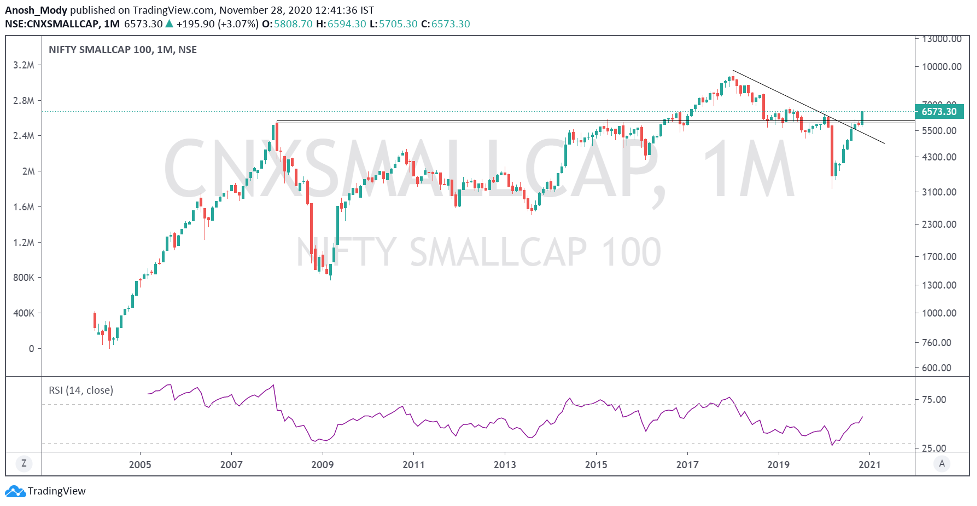
Some turbulence can be expected in this belt, as shown in the weekly chart
Nifty Smallcap 100 vs Nifty 50
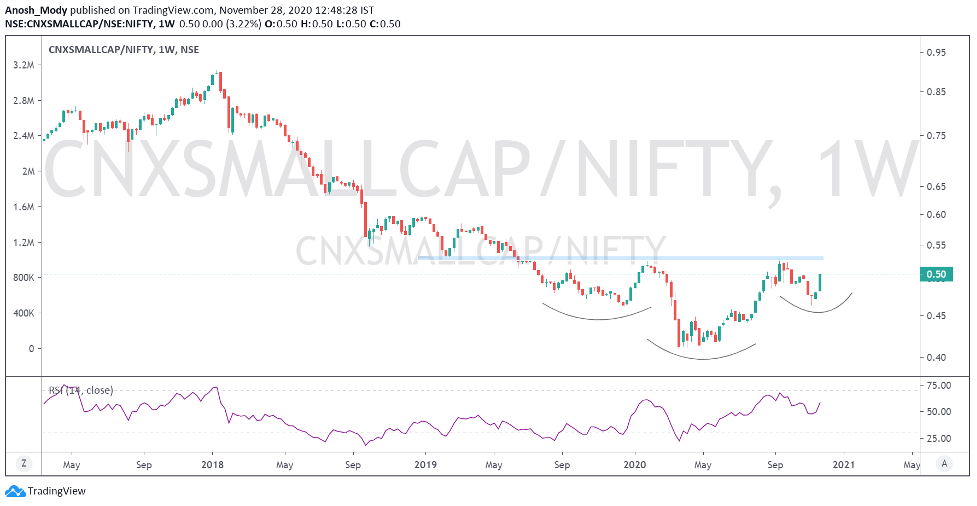
The ratio is forming an inverted H&S pattern with neckline as the CIP level marked in blue on the chart. Breakout above this can show good outperformance by smallcaps.
Currency
DXY
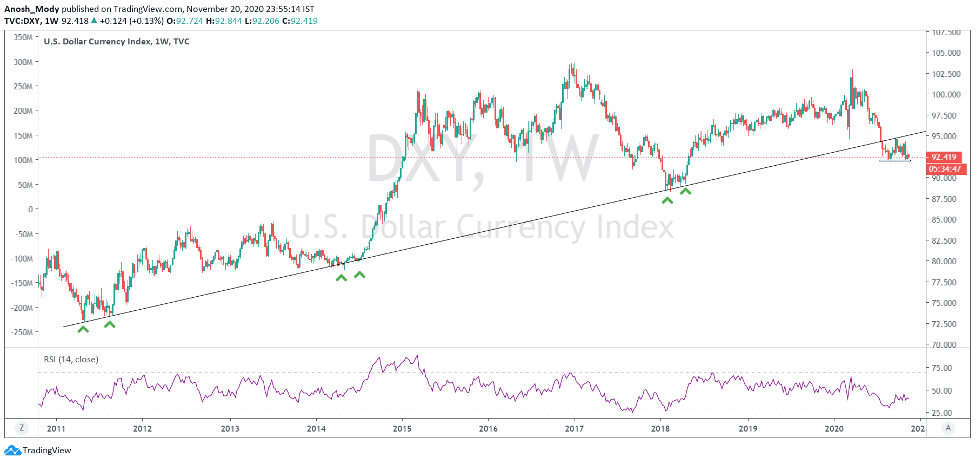
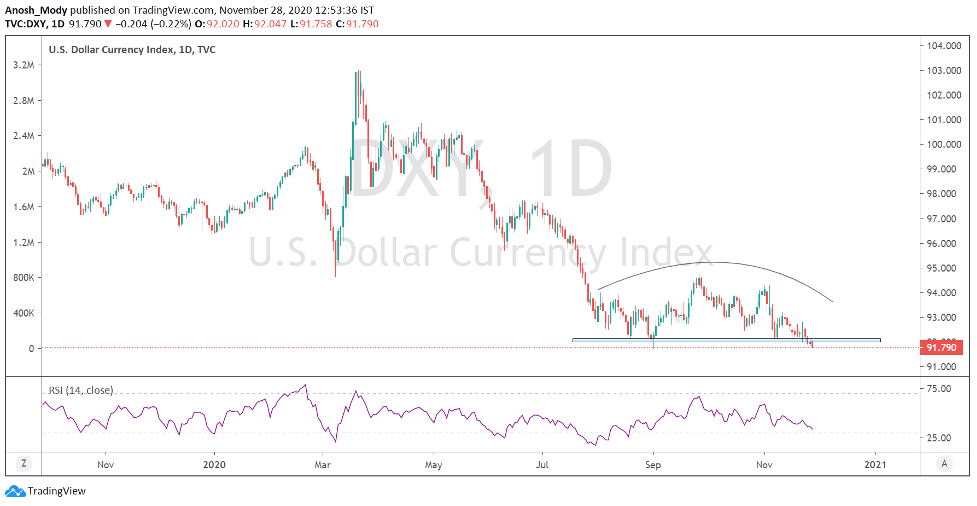
The dollar index finally looks ready to break down. After having formed a top, it is finally down from the crucial 92 level! A falling DXY is positive for global equities.
USDINR
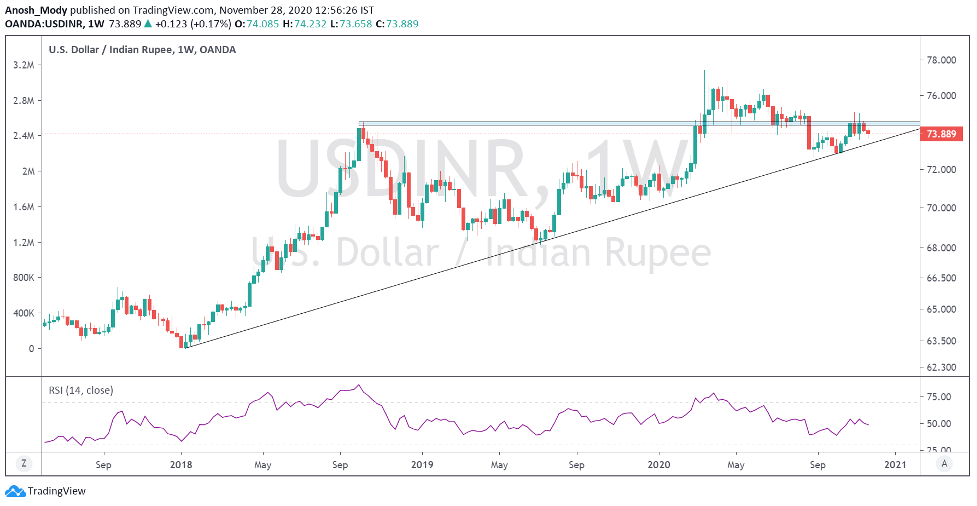
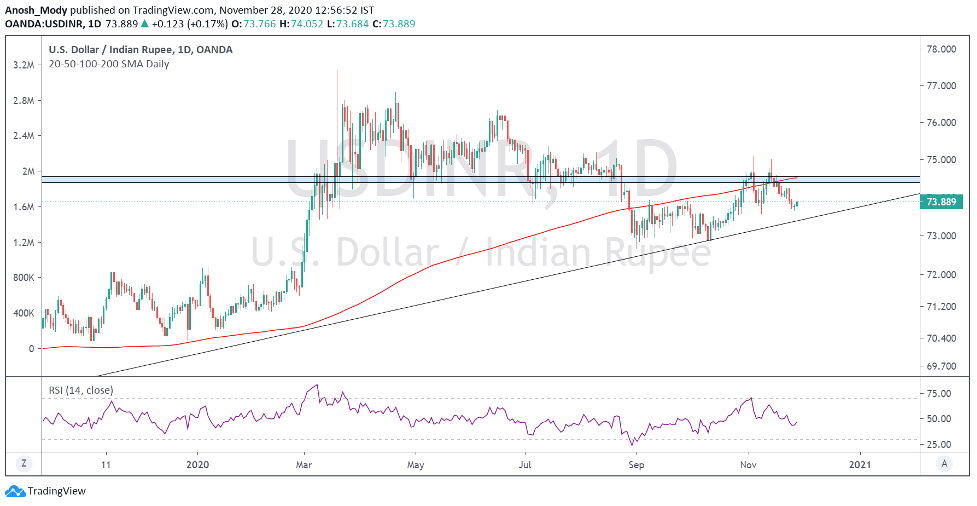
The currency pair moved lower from a historical CIP level, and is now nearing the long term trendline.
Sector View
Check out this tweet which has a long list of sector charts, for deeper insights into which sectors you should focus on in the days to come!
Sector View post November; A thread:
— Anosh Mody (@anoshmodyy) November 28, 2020
Nifty 50
The index had an insanely good month, closing ~11.4% in the green, breaking out to a fresh ATH, fueled by massive FII inflows of Rs. ~65k cr
(Data from @mystockedge)#investing #trading #Nifty #StockMarket https://t.co/88tiNH20iQ pic.twitter.com/9difE0tM9w
OI Analysis 6
Open interest or OI is the total number of open positions in the market. A high OI indicates that there is a lot of activity in that instrument. It does not indicate buyers and sellers individually but is instead a more holistic measure, i.e. it is the number of contracts between the buyers and sellers, not the buyers and sellers on their own. One of the ways OI analysis works is that high-volume market participants would have sold strangles at strikes which leads to higher OI. This type of reading does not typically account for other types of spreads that one may trade, but the data for it is available.
Nifty
OI range is incredibly narrow for this week’s expiry at just 100pts. This is in line with the indecisive weekly close (doji) and general consolidation that the market has faced this past week. So while on a broader scale the trend is bullish, short-term speculators may have second thoughts at current levels. OI on the call side seems higher, and going by how suppressed call prices were, it may point towards smart money potentially selling calls at higher levels.
If this is true, it may indicate that the markets may experience a speedbump in the otherwise linear uptrend. Of course, this is just one part of the analysis. There are always two sides to a story, so please understand that this is just one of the several interpretations of OI data that’s possible.

Bank Nifty
BN’s OI has consistently consolidated around this mark for the past few days now. This is odd as the banking sector has broken out and appears to be taking support after some profit booking candles.
As we mentioned earlier, BN is just 9% away from ATH. With Nifty already at ATH and BN so close, it may be likely that BN continues outperforming the broad-market, especially since institutional buying has a heavy weightage towards the BFSI sector.
On the OI front, our views are similar to Nifty’s. It will be interesting to see how the OI structure changes once BN closes decisively above 29,800-30,200

Heavyweights in the Nifty 50:
Let’s look at some important stocks in Nifty50 that collectively make up around 43.68% of NSE’s flagship broad market index. This figure is lower than last month’s which means that the weightage occupied by the top five stocks has reduced. The only culprit for this is RIL which underperformed severely.
In today’s edition, we have used a lot of Fibonacci retracements. This is because many stocks are either retracing or have broken out and are nearing FIB extension zones.
On the chart front, we’ve used naked charts, for the most part, to display the price action better.
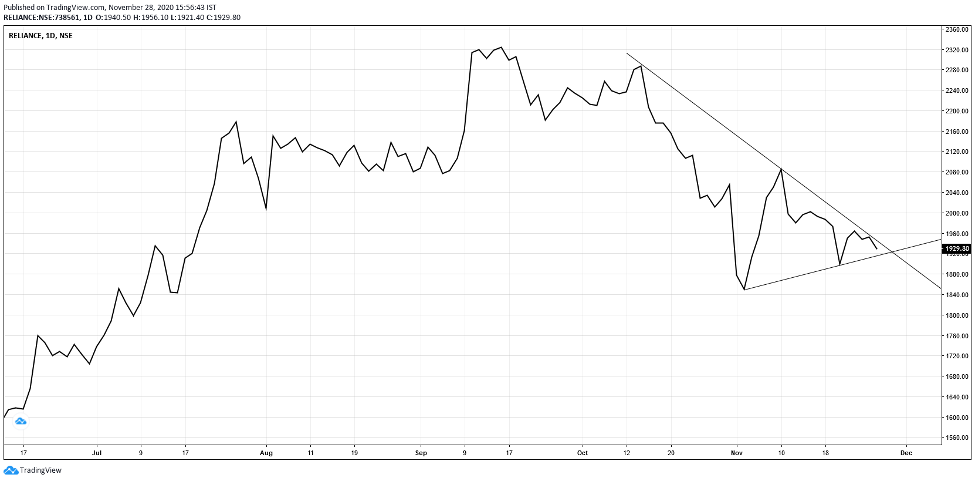
1. Reliance (13.24% weight): This week wasn’t kind to RIL either. The line chart helps us see how the price action has developed since the stock first turned back from ATH levels. The two trendlines show that RIL is at the crucial point of a triangular breakout (or breakdown). So far, the stock has seen modest accumulation at lower levels, with delivery percentages being reasonable, too. This means that if RIL finally breaks out (and sustains), it may be a key force in holding Nifty stable even if other stocks suffer. That being said, expect RIL’s moves to matter less as other stocks have gained more in relative terms and hence the weightages may have dropped. (Read the Basics of Dow Theory and trend by clicking here).
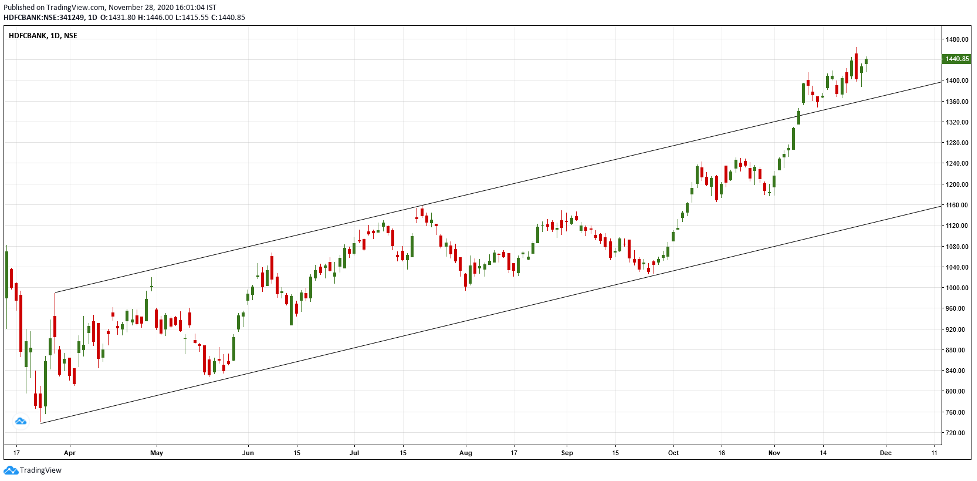
- HDFCBANK (10.25% weight): HDFCBANK has climbed reasonably well after breaking out of the channel resistance. As long as the trendline is respected, we may continue seeing bullish moves. Friday in particular shows great support at lower levels, with the price attempting levels lower than p.close but closing above previous low.
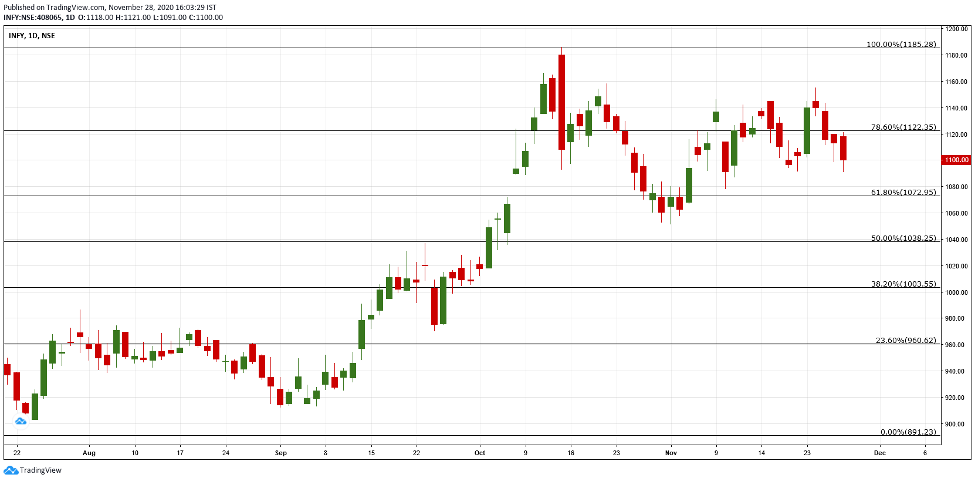
- Infosys (7.74% weight): The week hasn’t been kind to Infy with the stock breaching supports after CIP resistance. Unless current levels are sustained, we may see it make a move towards the FIB resistance marked. The 78.6% will then become an important level to cross and hold above. This should happen once the IT industry as a whole picks up pace..
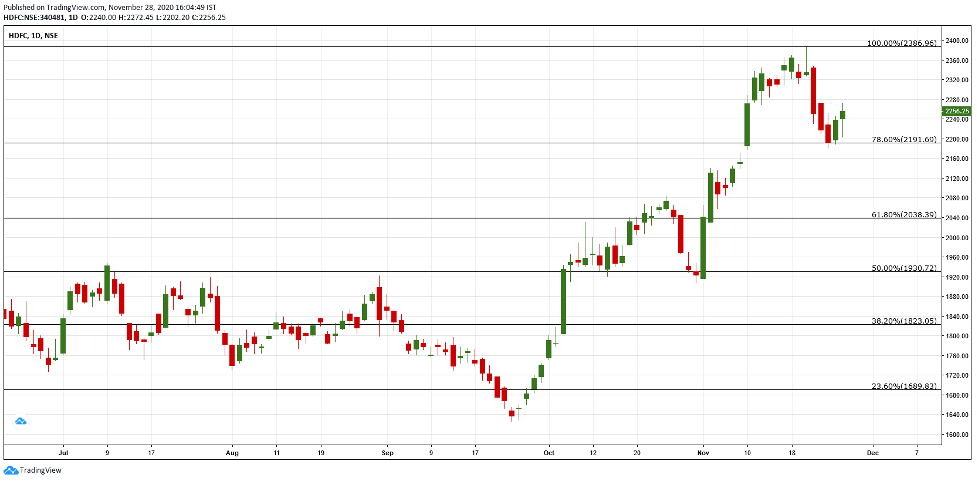
- HDFC (6.87% weight): HDFC bounced up very well from lower levels, right at FIB support. As long as the stock is able to sustain above Friday’s high, it may attempt ATH once again, provided sentiments are in check. Let’s also not forget that there is good speculation & news on the potential merger of HDFC Bank & HDFC which may act as an important news trigger.
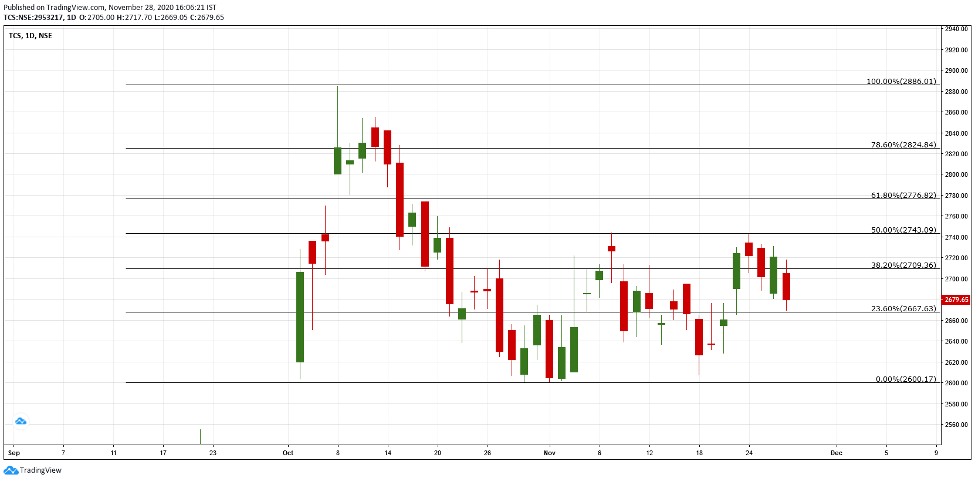
- TCS (5.58%): TCS looks similar to Infy. It will be crucial for the stock to hold 2670. If breached, it may break the shorter-term uptrend witnessed and may result in fresh bears entering. Again, this could be more of a sectoral issue rather than a stock-specific one.
Heavyweights in Banknifty:
Since we have started analysing Banknifty in Market Chronicles, we decided to include some top movers of Banknifty. The number one mover is HDFC Bank, which has already been spoken about in the previous section, so we will discuss two other important stocks here, namely Kotak Bank and SBI. Other banks have an impact on the index, but these along with ICICI Bank are typically the movers.
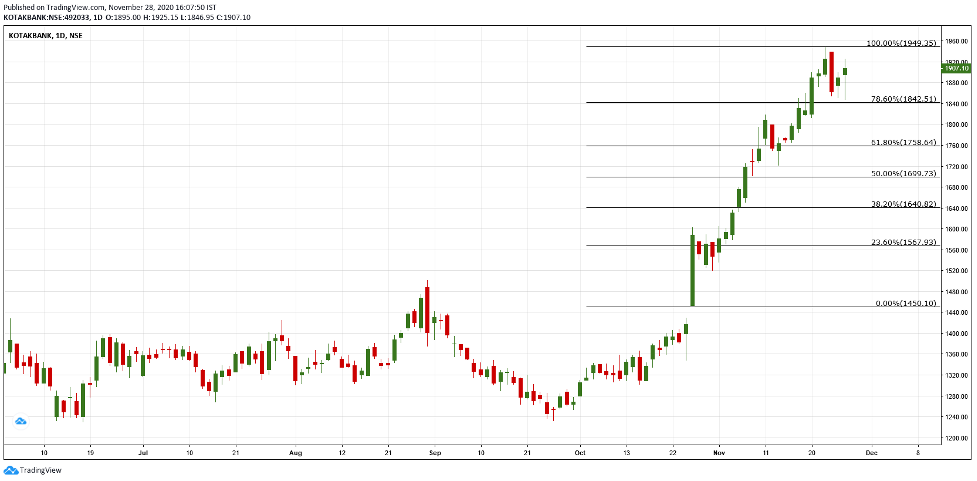
- Kotak Bank: Below we’ve retraced Kotak Bank from the gap up candle that broke the market structure and we can see that the 78.6% level seems to be acting as a good demand zone for the stock. This may also be due to the strong FII buying witnessed by the markets which may have resulted in all dips being bought into. So while it is a positive sign in itself, if the market context changes, these dips may be a cautioning sign. As long as the stock sustains above Friday’s high, it may have enough momentum to break the ATH resistance.
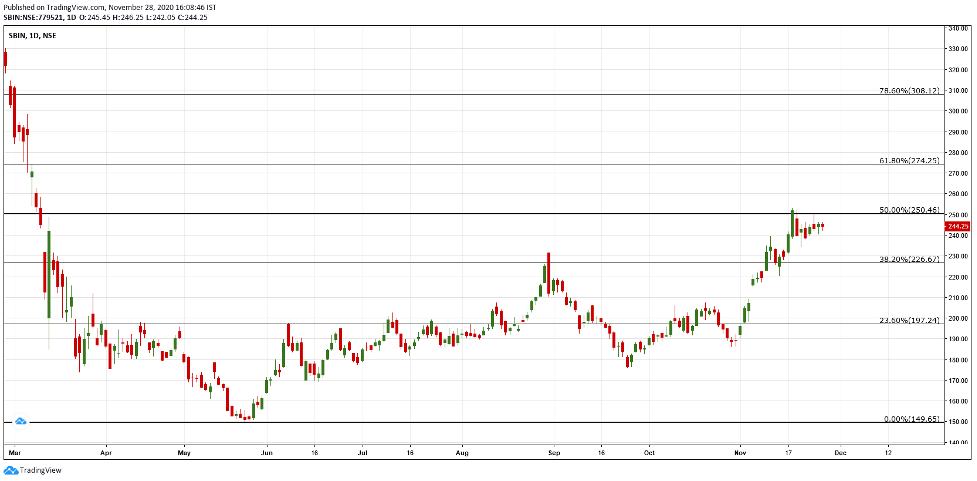
- SBIN: SBIN has come a long way since last month’s levels, but the past week saw strong consolidation for the stock. The 250 level was attempted a couple of times, but to no avail. A close above 250.5 may trigger new bullish positions as it would indicate a break of a major resistance. Sentiments seem positive overall as lower wicks are higher, showing buying at lows, and the stock is around levels that it’s never been since the COVID selloff.
Volatility:
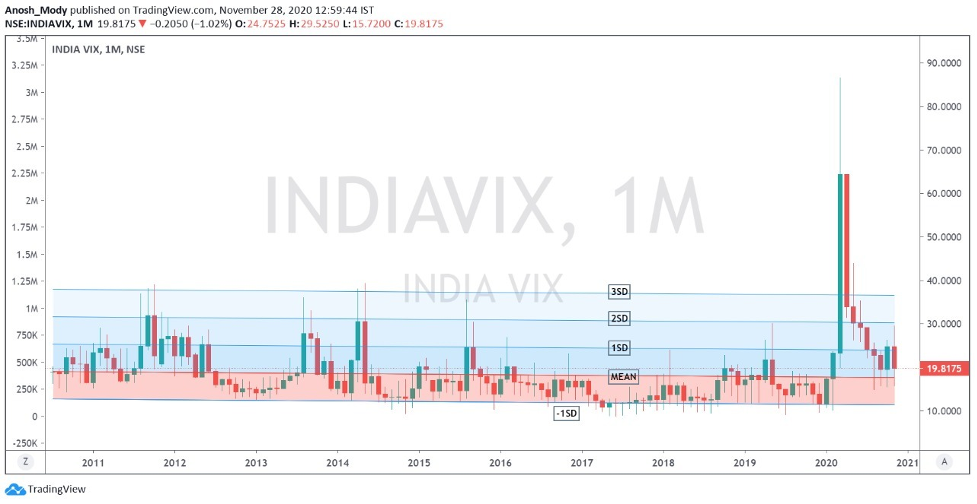
VIX is back to mean levels. Interestingly, November as a month was inherently filled with volatility thanks to US elections and other important events like vaccine development, etc. We saw it touching 2SD levels but those were rejected, possibly due to the stability provided thanks to strong institutional buying.
The real question becomes that will the index bounce up from this level or continue moving sideways. This, understandably, will have a material impact on option prices and sentiments.
For your reference, a lower VIX (or lower volatility) is generally associated with price moves that are less choppier and more trending. It also results in lower option prices (due to a lower IV). But at the same time, the ATR (Average True Range) [https://www.investopedia.com/articles/trading/08/average-true-range.asp] of the stock would be narrower.
Moving Averages decoded: https://www.investopedia.com/terms/m/movingaverage.asp 1
Demystifying the art of Fibonacci Retracements: https://www.investopedia.com/terms/f/fibonacciretracement.asp 2
The basics of Dow Theory: https://www.investopedia.com/terms/d/dowtheory.asp 3
What are trendlines?: https://www.investopedia.com/terms/t/trendline.asp 4
Gaps made easy: https://www.investopedia.com/terms/g/gap.asp 5
Open interest explained: https://www.investopedia.com/terms/o/openinterest.asp 6
Disclaimer:
We, Anosh Mody & Krunal Rindani shall take no responsibility for any profit or losses occurring out of investment/trading decisions you make based on the contents of this article.
We are not SEBI registered investment advisors. This article is meant for educational purposes only, please consult your investment advisor before acting upon any information you see here.
We may or may not have open positions, kindly assume that we are biased.
Anosh Mody is an MBA student from SBM, NMIMS Mumbai. However, the views reflected in this article are strictly his own, and in no way reflect upon the B-School in any manner.
Follow Us @

