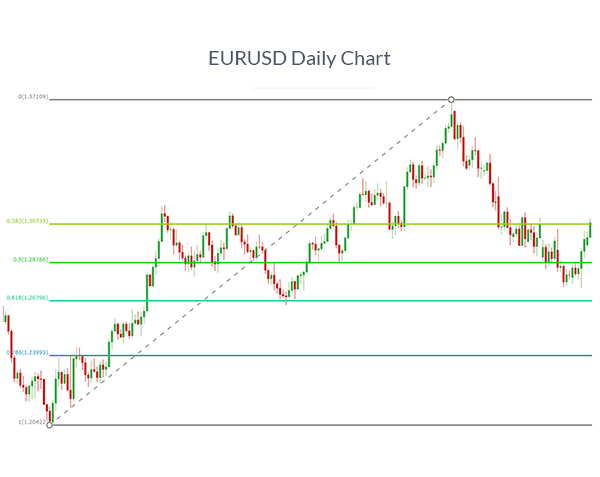
Based on the very cryptic Golden Ratio, and it’s derivatives, fib retracements are often termed misconstrued in trading. Personally I find them to be quite effective.
All charting softwares have fib retracement tools. A retracement is drawn by connecting the high and now of a particular swing move, and the levels thus plotted are considered to offer support and resistance when price comes near them.
A fairly easy to use indicator that works on any timeframe, and is best used in conjecture with other indicators.
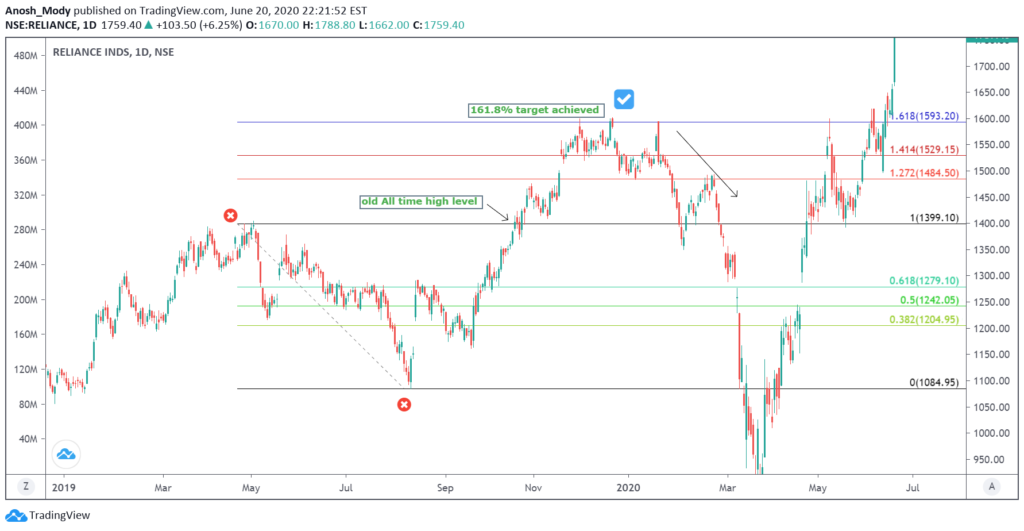
The most commonly used fib ratios are 38.2%, 50% and 61.8%. 23.6% and 78.6% are also common. In measuring probable targets for stocks at all time highs, 127.2%, 141.4%, 161.8%, 200% and 261.8% are quite handy. Here’s an illustration, quite recently seen on Reliance Industries.
The retracement is drawn between points marked by red crosses. Once the stock broke out to make a new ATH in September 2019, the targets were plotted as shown. It achieved its target 161.8% target with perfection, before faltering lower.
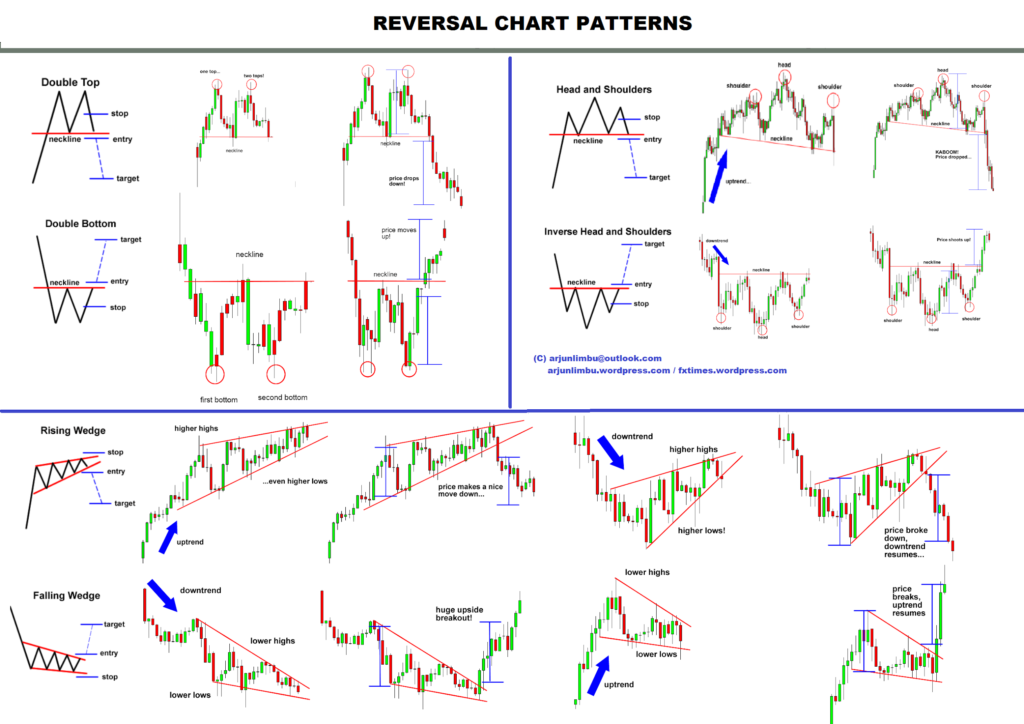
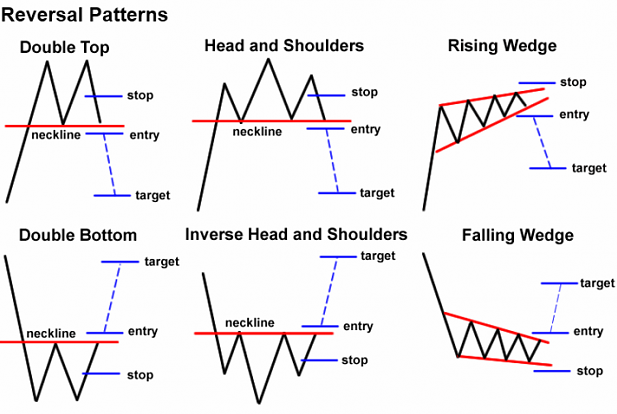
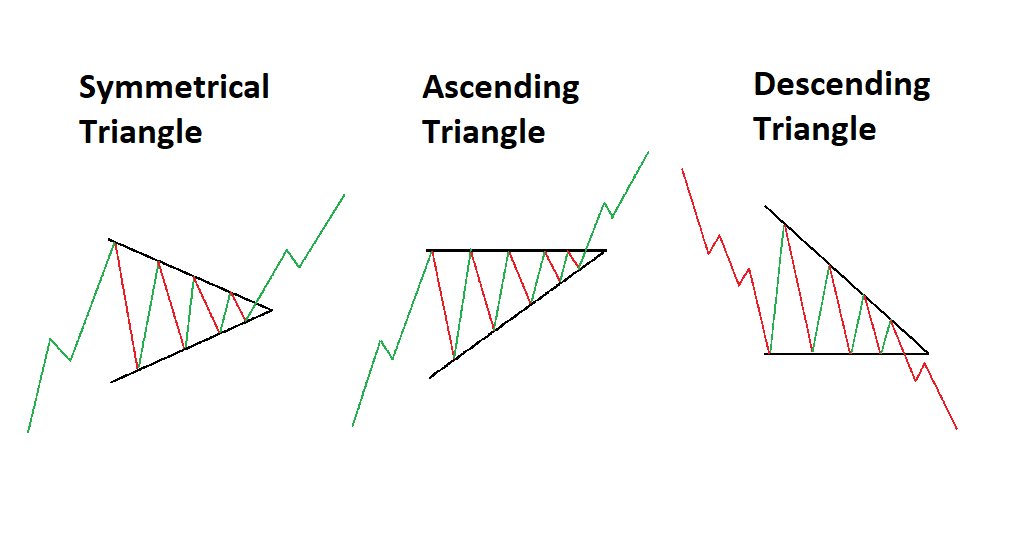
Some exciting chart patterns
The symmetrical triangle is one of the most reliable patterns on any time frame and a personal favourite.