Market Chronicles for the week ended 11th December, 2020.
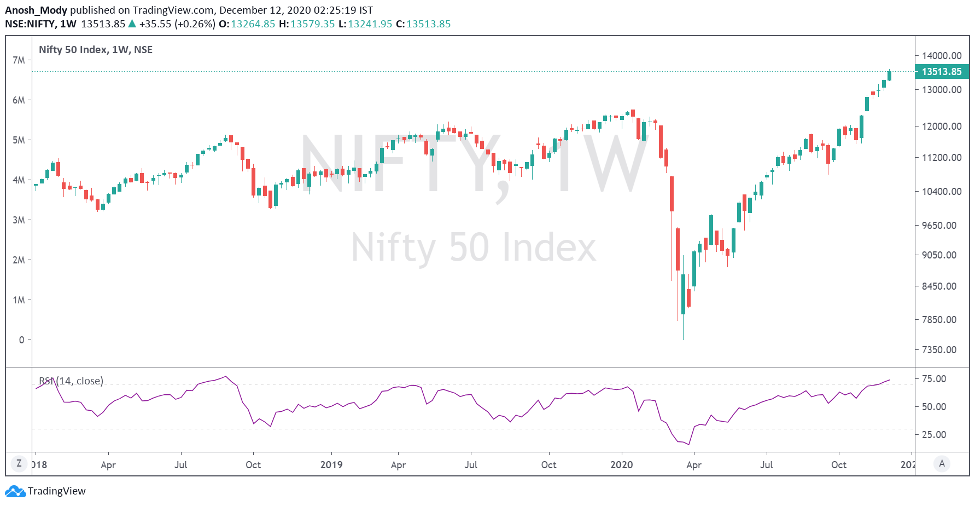
Nifty ended the second week of December 1.93% in the green. Even as naysayers called a top on every rally, supply was absorbed, and stocks performed decently well this week.
We maintain that even though the markets are extended, we are in a firm uptrend, and we remain BULLISH going forward. Any dips should be considered buying opportunities.
Please read on to understand our rationale. This article contains an analysis of technical parameters as well as open interest and derivatives data. All the information below has hints for what levels to watch out for in weekly trade. Replicating these on your charting software and keeping an eye on them can help minimize unpleasant shocks in your trading.
Note: Our directional views are subject to sudden and drastic change mid-week. For anyone who wants a daily update on the stock markets, we suggest you follow us on Twitter, for some more frequent insights. Our handles are @anoshmodyy and @MarketsWithKR
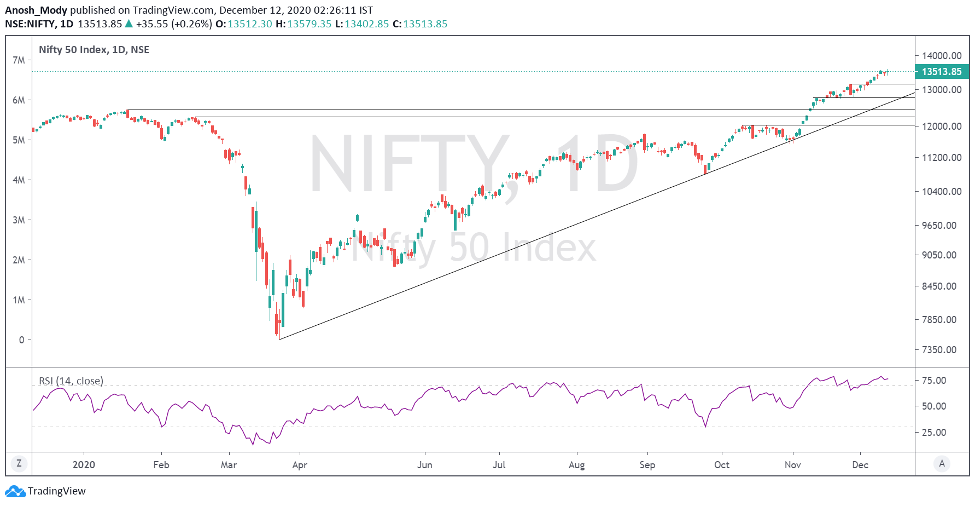
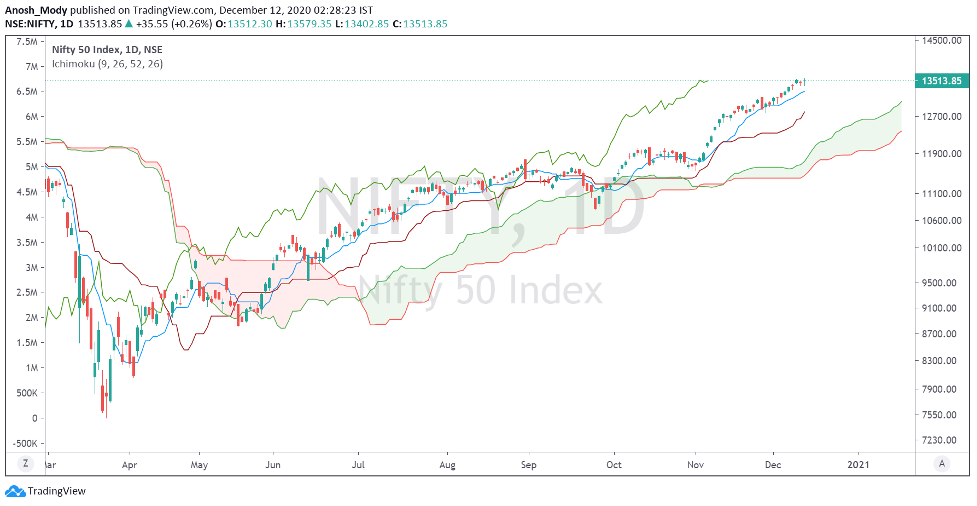
The daily chart has some key support levels marked, to watch out for in case of a deeper correction. We cannot rule out the possibility of a retest of the pre-COVID high, and that remains an important belt to watch in case the market crashes
Moving Averages
A quick snapshot of how the major Moving Averages are placed on the daily chart.
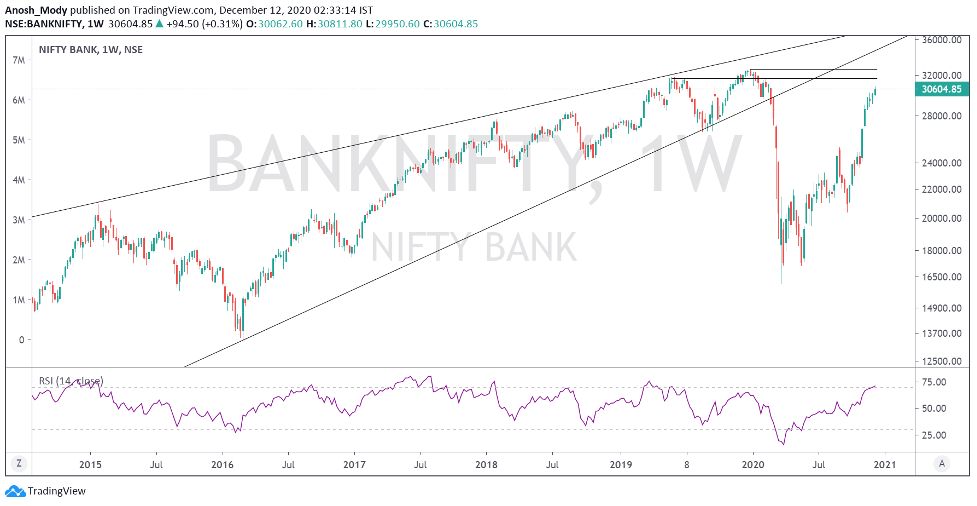
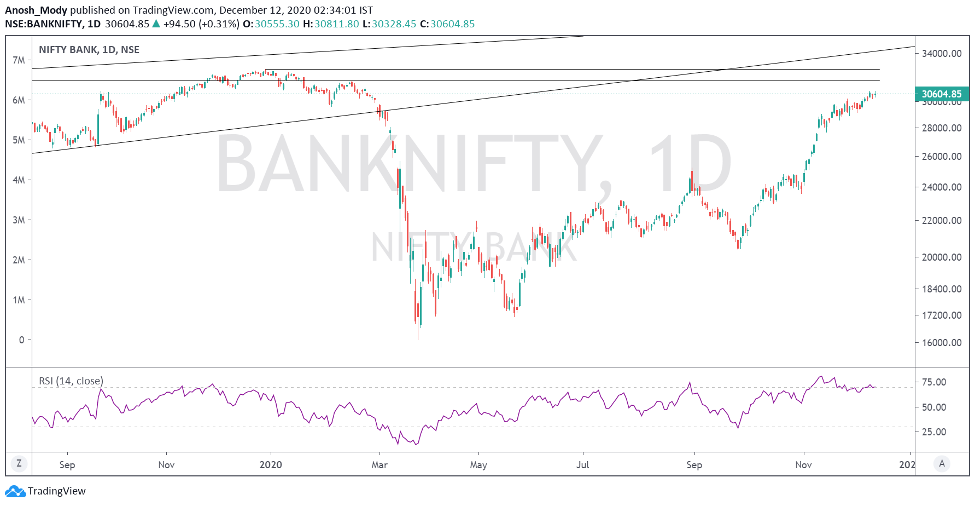
Strong move by the bank index this week, as it ended a good 1.8% in the green, now just ~6.6% away from ATH!
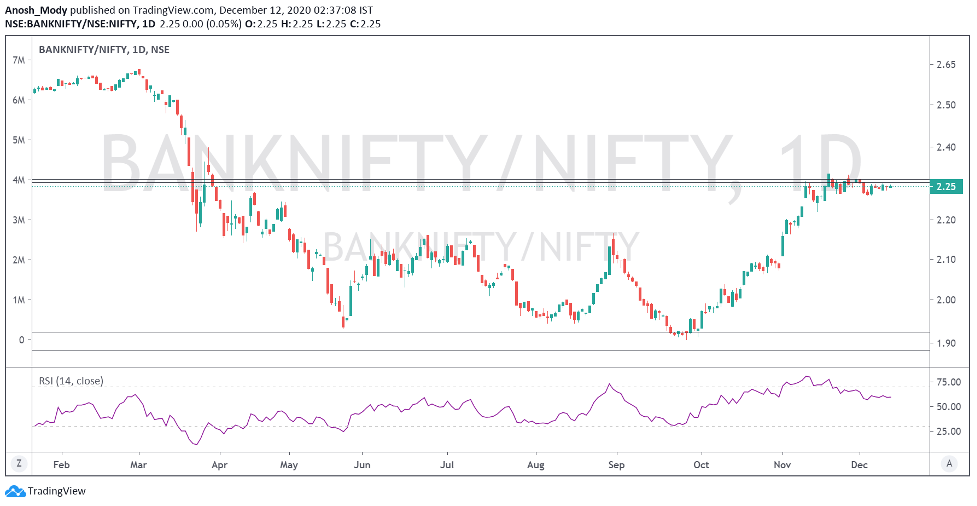
Bank Nifty vs Nifty (Relative Strength Chart)
The weekly relative strength chart is now facing resistance at a crucial CIP level!
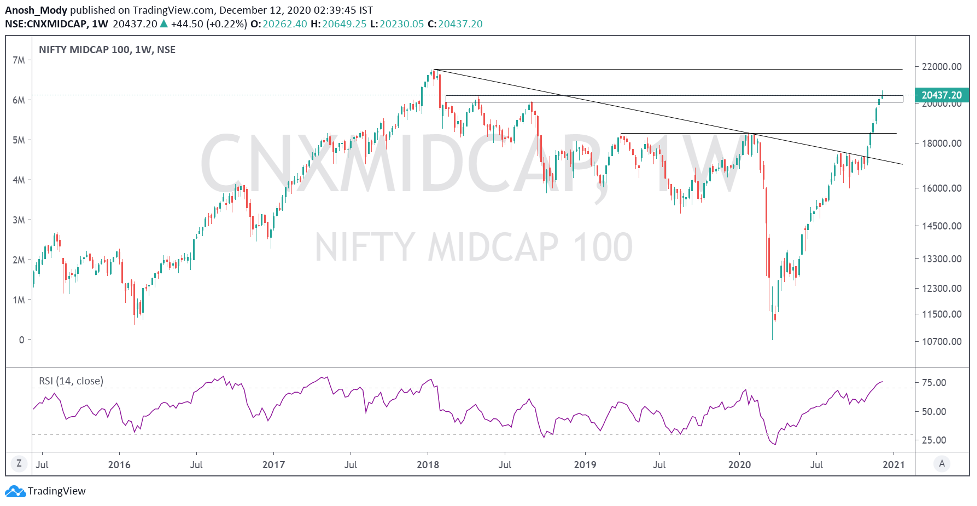
Nifty Midcap 100
While the midcap index had a good week again, closing 1.2% in the green, and now just 7% away from all time high, 20050-20400 could be a turbulent zone for the index
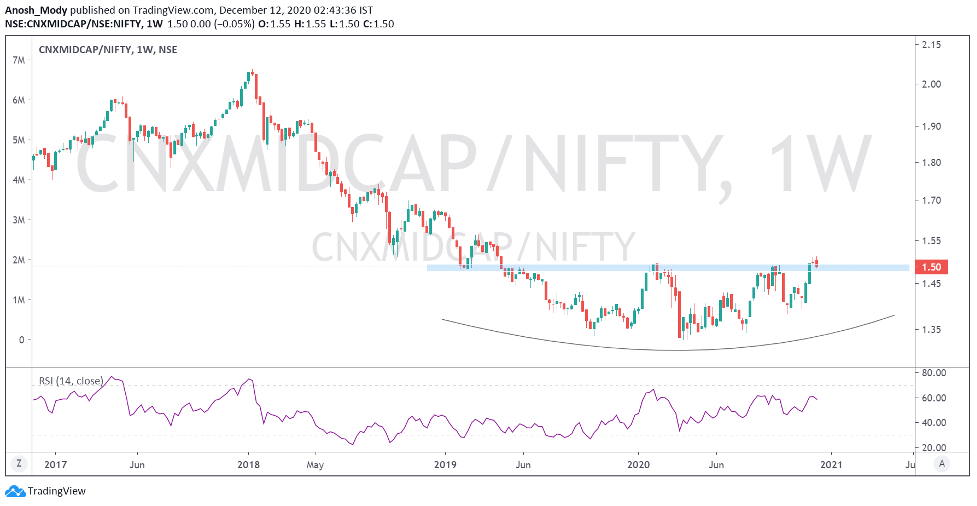
Nifty Midcap 100 vs Nifty 50
Midcaps are breaking out relative to Nifty50, and saw a retest of the flat top this week. Overall, it seems as though mid caps are looking to outperform
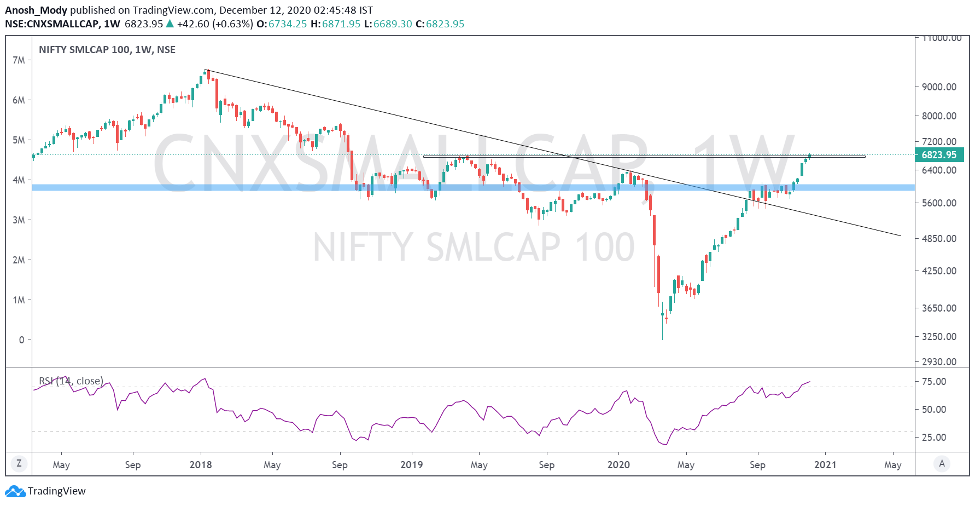
Nifty SmallCap 100
Smallcaps had a good week, with the index closing 1.9% in the green.
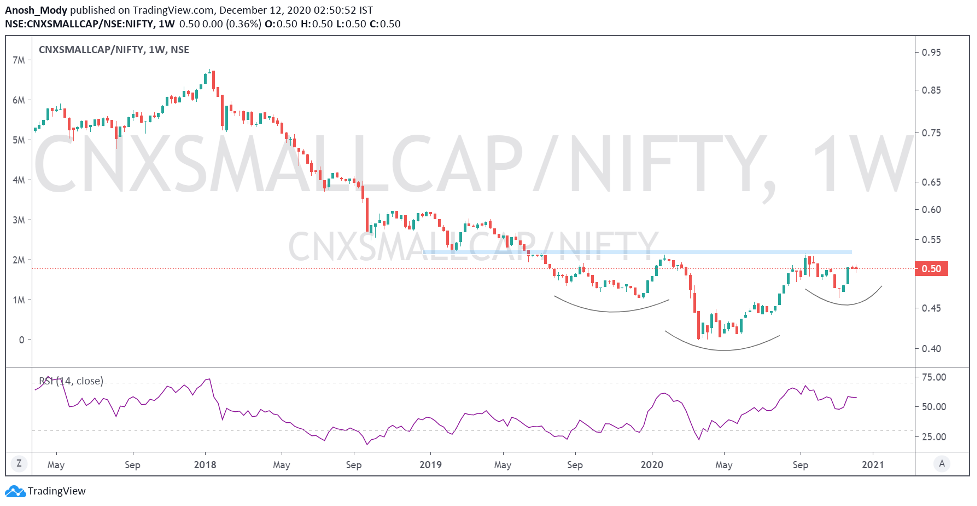
Nifty Smallcap 100 vs Nifty 50
The ratio is forming an inverted H&S pattern with neckline as the CIP level marked in blue on the chart. Breakout above this can show good outperformance by smallcaps.
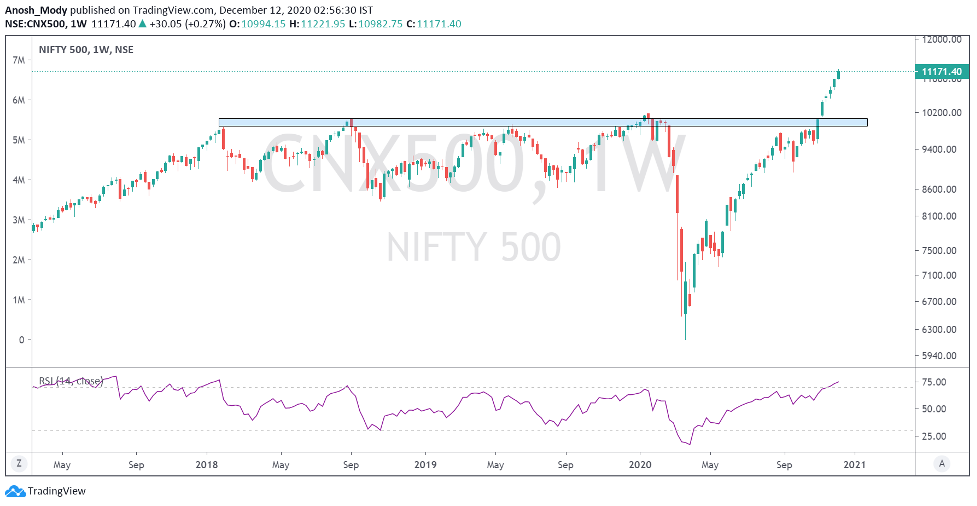
Nifty 500
The broad market measure of Indian stocks also did very well this week to close 1.75% in the green
The relative chart is facing some turbulence near the flat top.
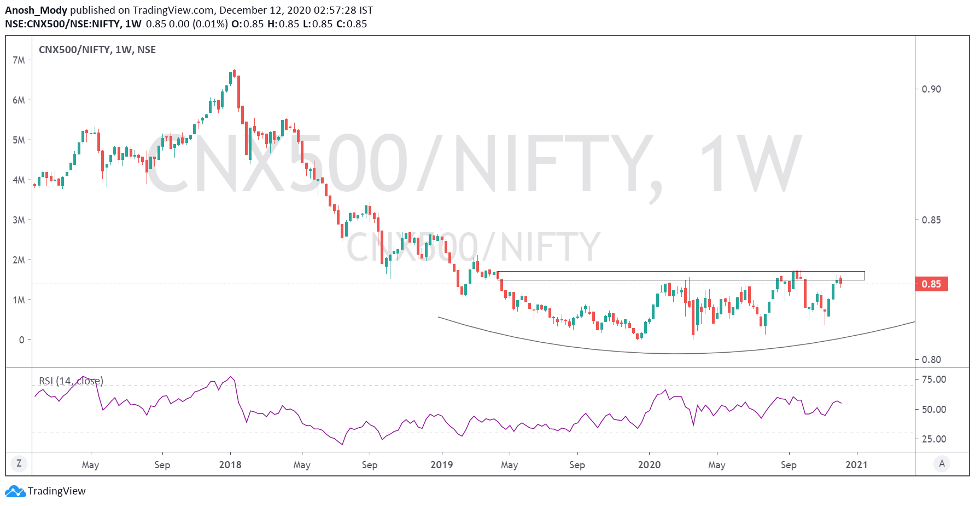
Nifty 500 vs Nifty 50
The relative chart is facing some turbulence near the flat top. Breakout above that will see good outperformance by the broadmarket
Currency
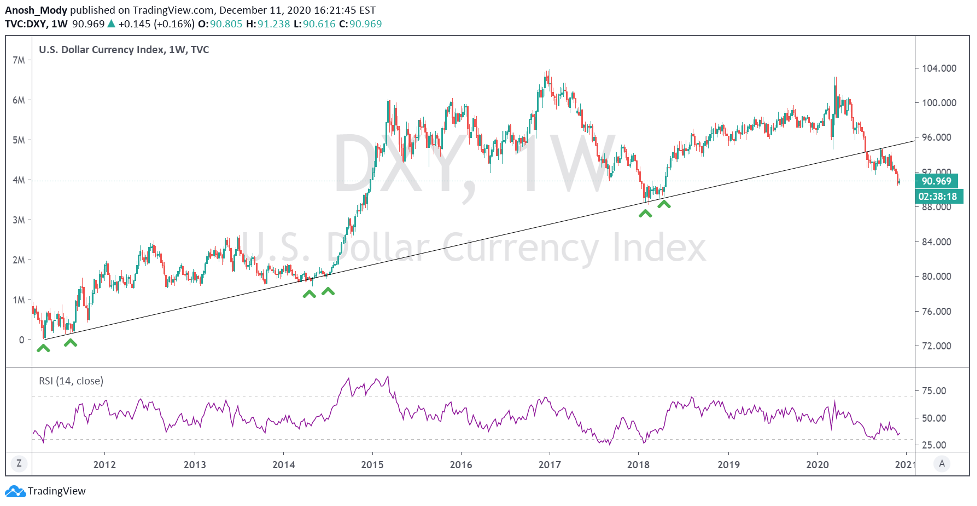
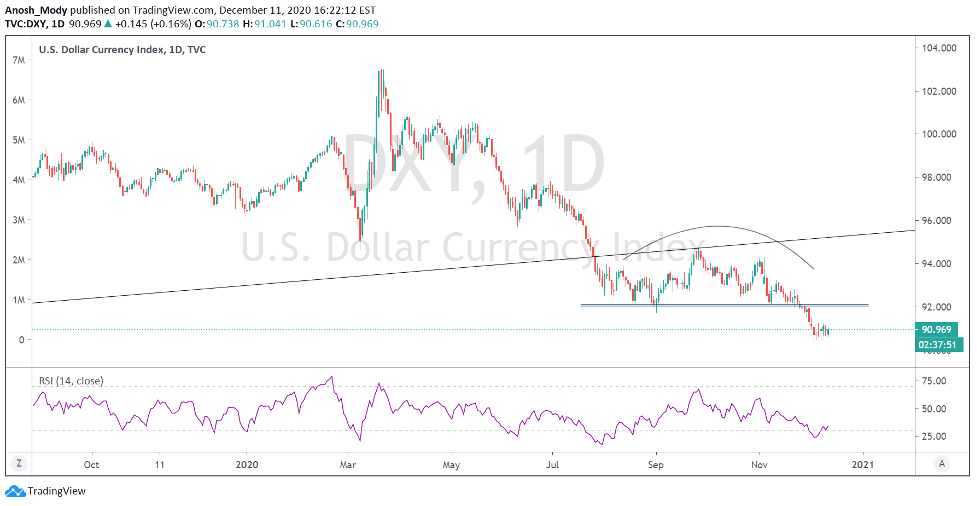
DXY
As anticipated, the DXY continues to move lower after breaking down the support level of 92. This is overall quite positive for global equities
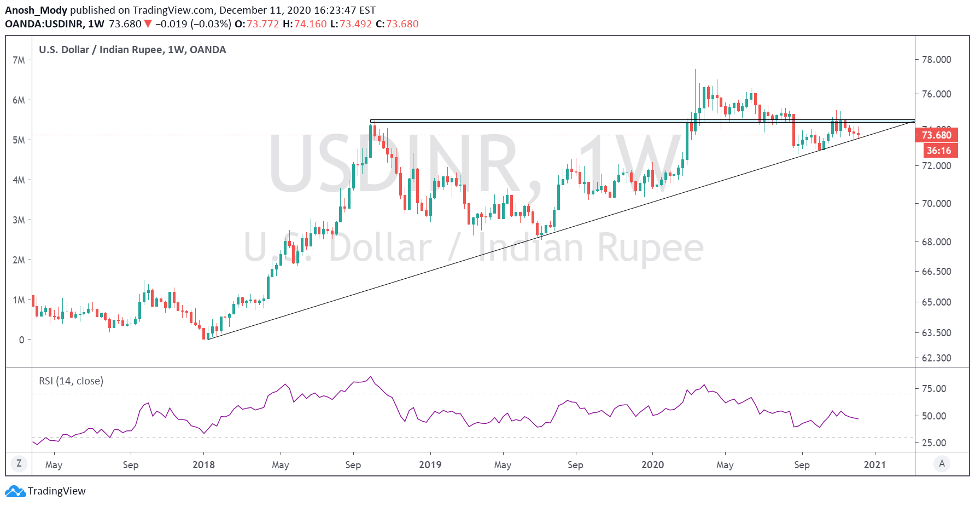
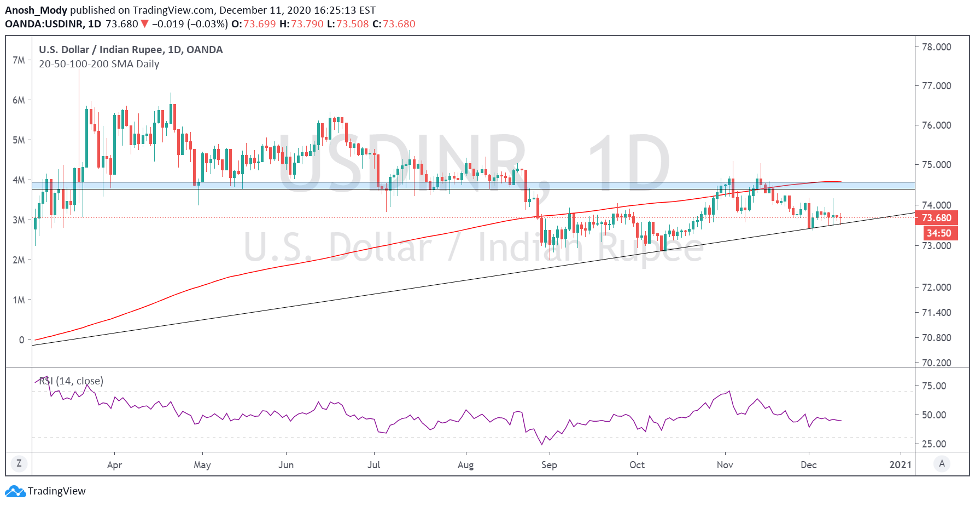
USDINR
The currency pair found support on the long term trendline and if the breakdown doesn’t happen soon, the major resistance level of 74.40-74.50 can be tested again
OI Analysis 6
Open interest or OI is the total number of open positions in the market. A high OI indicates that there is a lot of activity in that instrument. It does not indicate buyers and sellers individually but is instead a more holistic measure, i.e. it is the number of contracts between the buyers and sellers, not the buyers and sellers on their own. One of the ways OI analysis works is that high-volume market participants would have sold strangles at strikes which leads to higher OI. This type of reading does not typically account for other types of spreads that one may trade, but the data for it is available.
Nifty
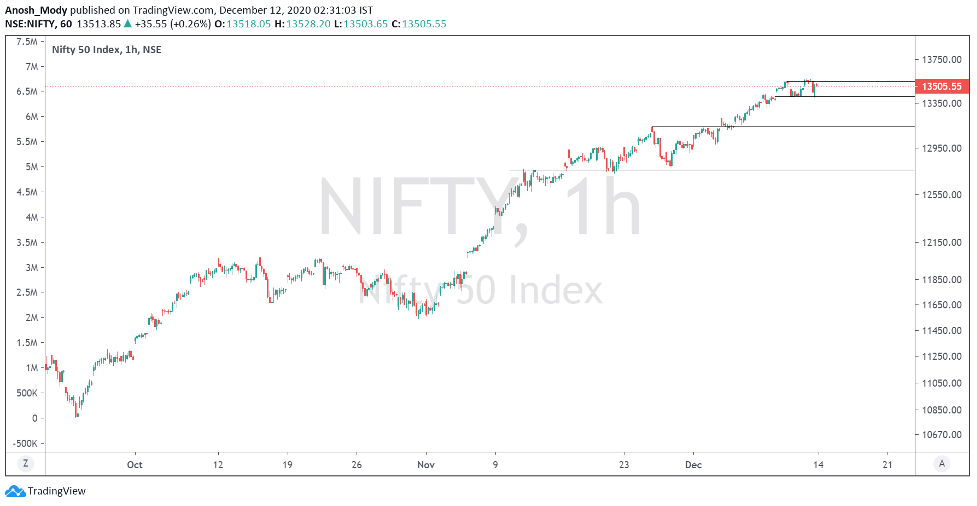
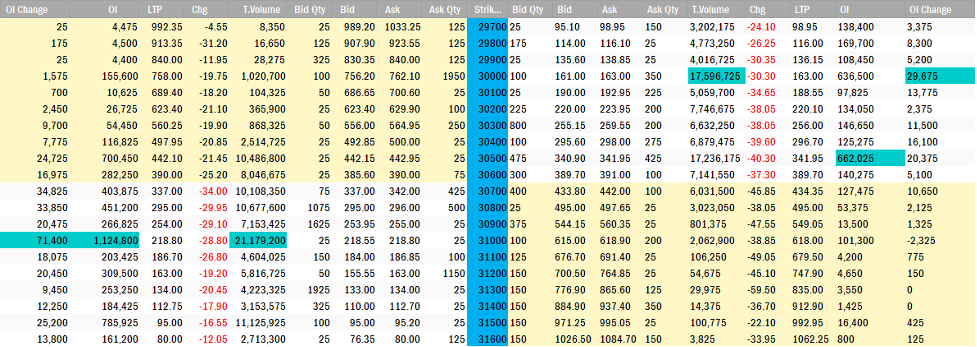
Despite some hesitant moves this past week, Nifty seems to have formed a strong base at 13,500. In fact, even though 13400 was almost touched, highest put OI remains unaffected at 13,500 with addition seen at 13,150.
Highest call OI meanwhile has increased, possibly expecting the bullishness to continue.
Bank Nifty
Banknifty OI looks strong above 30,000. The index is just 400pts away from its upper bound of 31,000 which may be a challenge as Nifty is 500pts away from its upper bound. It may indicate that some expect BN to consolidate due to overwhelmingly good performance by PSU banks and weak moves by HDFC Bank, the index’s leader.
The overall appearance looks unmistakably bullish though.
Heavyweights in the Nifty 50:
Let’s look at some important stocks in Nifty50 that collectively make up around 42.66% of NSE’s flagship broad market index. This figure is lower than last month’s which means that the weightage occupied by the top five stocks has reduced. Another significant change is that Reliance Industries has lost its top spot to HDFC Bank and TCS has exited the Top 5, making way for ICICI Bank.
In today’s edition, we have used a lot of Fibonacci retracements. This is because many stocks are either retracing or have broken out and are nearing FIB extension zones.
On the chart front, we’ve used naked charts, for the most part, to display the price action better.
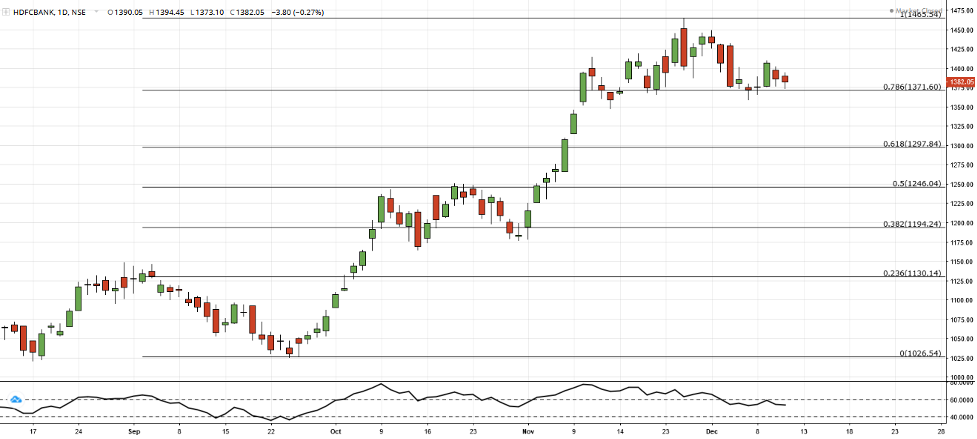
1. HDFC Bank (11.21% weight): After news of the bank’s digital license being suspended, HDFC Bank hasn’t been able to regain momentum. However, it’s holding steadibly above 1,370 FIB support which is a bullish sign. As long as this level is maintained, attempting 1,400 again should be very doable. (Read the Basics of Dow Theory and trend by clicking here
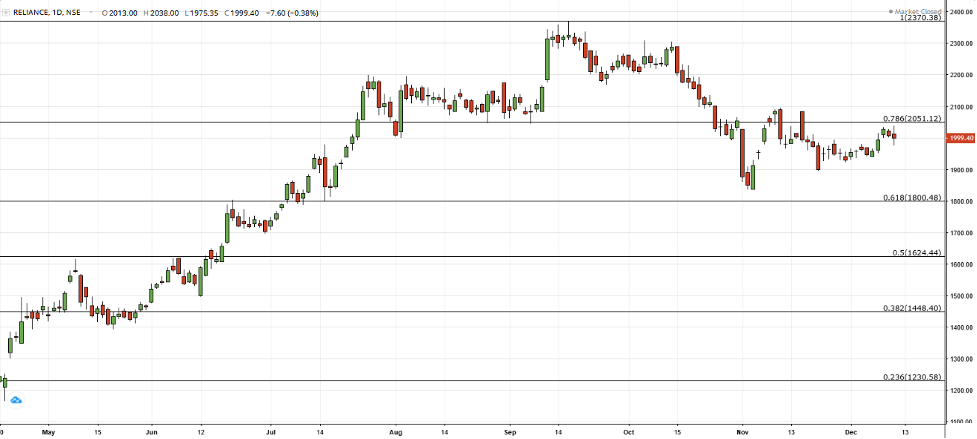
Reliance Industries (11.17% weight): Reliance closed on a positive note on a weekly basis for the first time since September. The Daily chart below shows that it’s the first time the stock has not shown dojis or sharp falls since early Nov. The Reliance products boycott movement seems to have had little impact on the stock price this Friday, but it remains to be a potentially important news-based factor. As long as the stock maintains above 2,000 and breaches 2,050 the stock seems bullish.
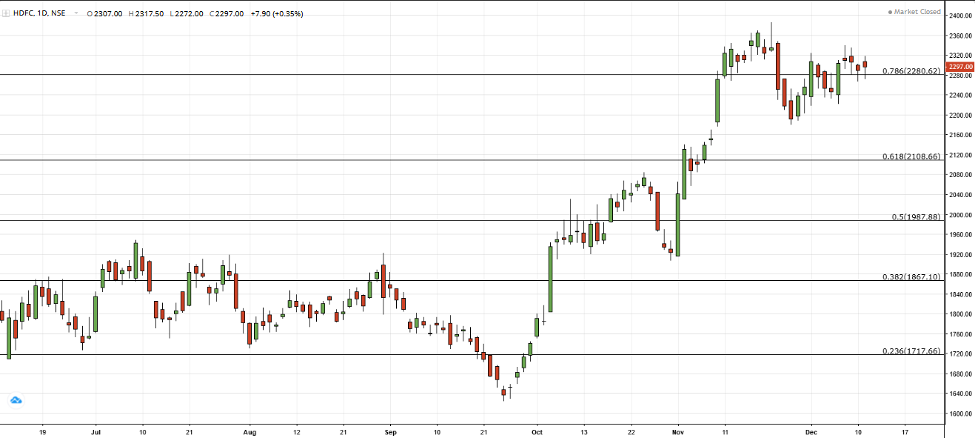
HDFC (7.23% weight): HDFC seems to be forming a base at the 78.6% FIB level, just like HDFC Bank. As long as this level is held, the stock is bullish. Overall view is similar to its banking twin.
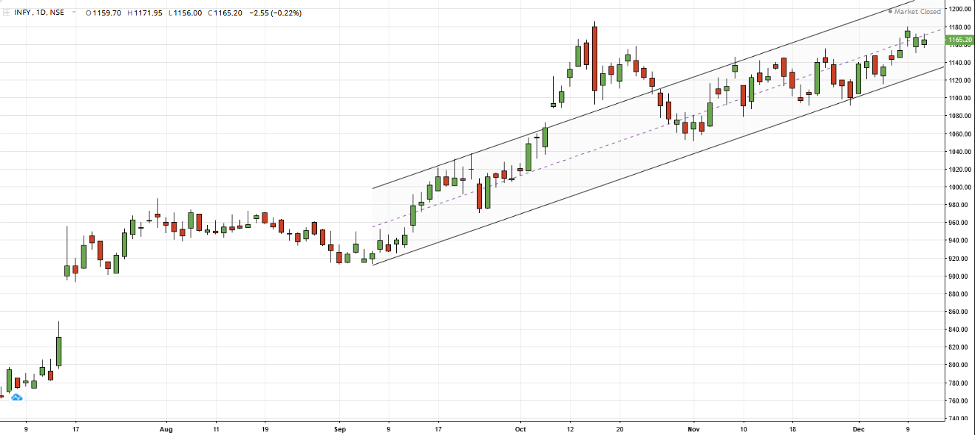
Infosys (7.21% weight): Even though IT has moved largely sideways in the past few weeks, Infosys has shown fairly bullish movements within the uptrend channel. As long as this channel is respected, the stock should perform well. In general, the IT sector has broken out after consolidating for the better part of 8 weeks, this means that the sector (and Infosys) has quite a lot of potential!
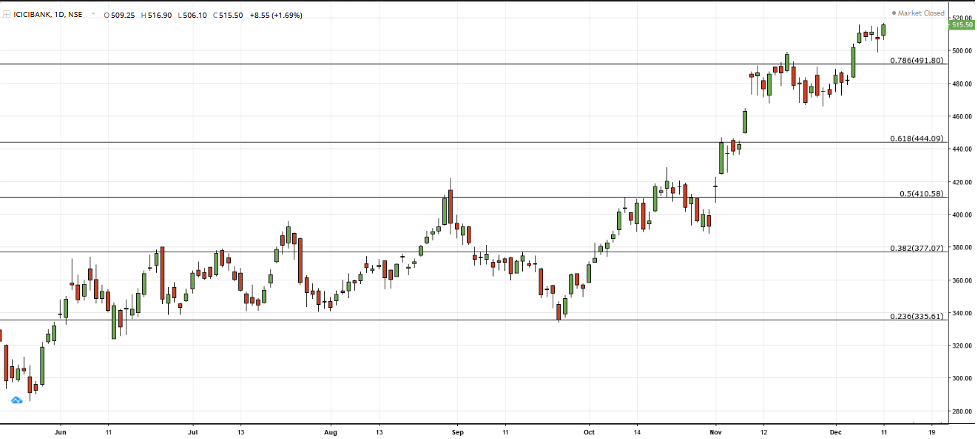
ICICI Bank (5.84%): After a largely flat week, ICICI Bank showed a strong move on Friday when the rest of the market was in a fix. The overall trend is bullish as long as 490 is held.
Heavyweights in Banknifty:
The number one mover is HDFC Bank, which has already been spoken about in the previous section, so we will discuss two other important stocks here, namely Kotak Bank and SBI. Other banks have an impact on the index, but these along with ICICI Bank are typically the movers.
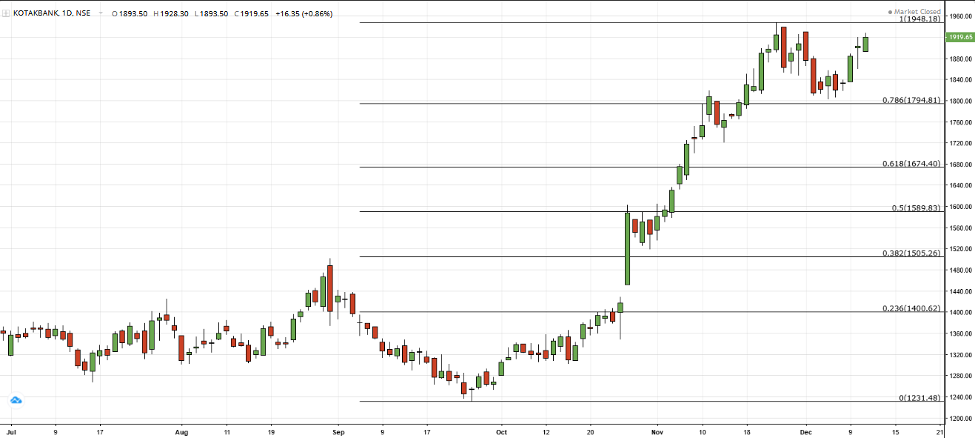
Kotak Bank: After bouncing up from 78.6% FIB, Kotak is on its way to create a fresh ATH. With a consecutive close above prev high in the last four sessions, bulls are clearly in power. Whether it is able to create a fresh ATH could also depend on the general market sentiment this coming week.
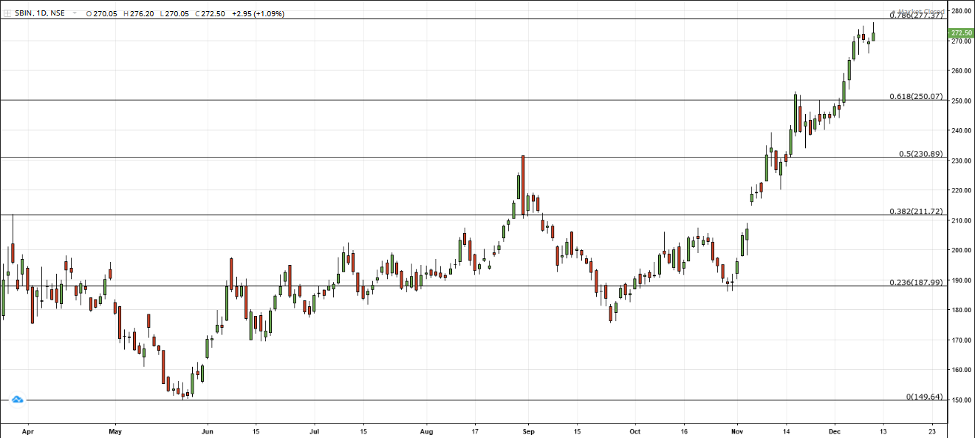
SBIN: After a phenomenal ride, SBIN seems to be halting at resistance around the FIB level at 277. Granted it coincides with a point where general profit booking could be possible, the resistance at this level cannot be ignored. As long as 265 is held, bulls should have sufficient momentum to breach 277.
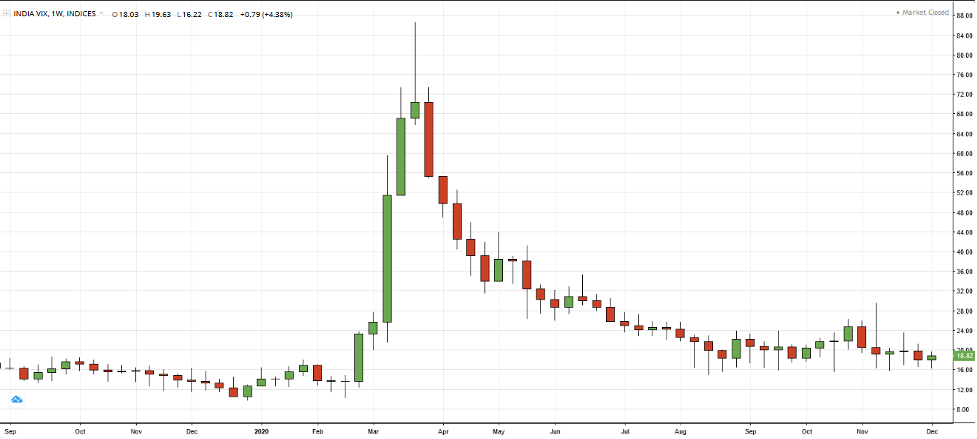
Volatility:
VIX closed below 20, an important sign but it seems to be taking support at this level which could point towards potential uncertainty in the market, and with Q3 earnings expected sometime in Dec-Jan, it may give further direction to market participants about the post-COVID business scenario. This may, in turn, impact volatility.
We, Anosh Mody & Krunal Rindani shall take no responsibility for any profit or losses occurring out of investment/trading decisions you make based on the contents of this article.
We are not SEBI registered investment advisors. This article is meant for educational purposes only, please consult your investment advisor before acting upon any information you see here.
We may or may not have open positions, kindly assume that we are biased.
Anosh Mody is an MBA student from SBM, NMIMS Mumbai. However, the views reflected in this article are strictly his own, and in no way reflect upon the B-School in any manner.


