Market Chronicles for the week ended 17th July, 2020.
Nifty had an absolute roller-coaster of a week, in line with our HIGHLY CAUTIOUS outlook from 2 weeks ago! However it seems we are out of the range we were trapped in for 10 sessions!
Our outlook is once again BULLISH, as long as Nifty sustains above 10900 as we may see swift gap closing to the upside in the coming sessions
Please read on to understand our rationale. This article contains an analysis of technical parameters as well as open interest and derivatives data. All the information below has hints for what levels to watch out for in weekly trade. Replicating these on your charting software and keeping an eye on them can help minimize unpleasant shocks in your trading.
Nifty had a very exciting week! Here are a few charts to illustrate all that happened
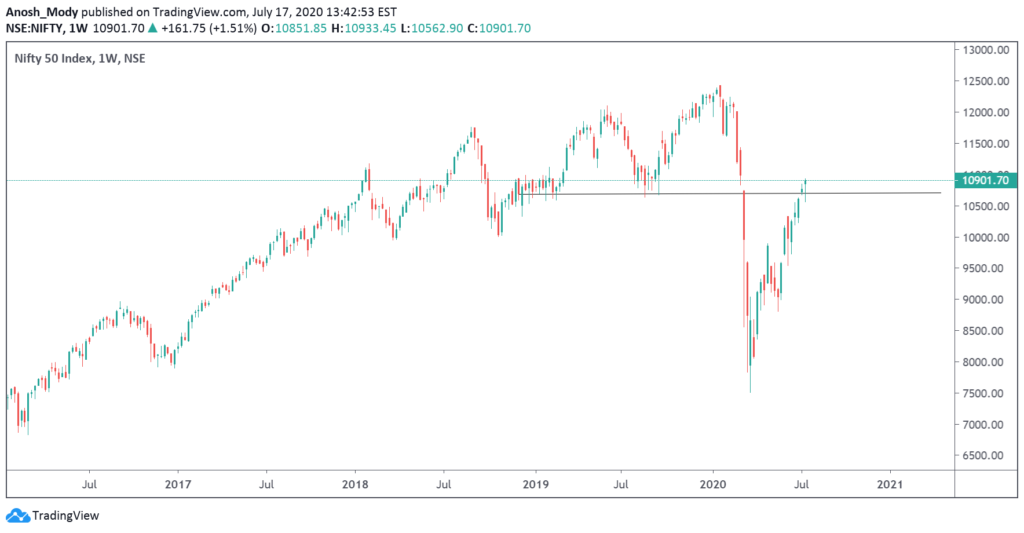
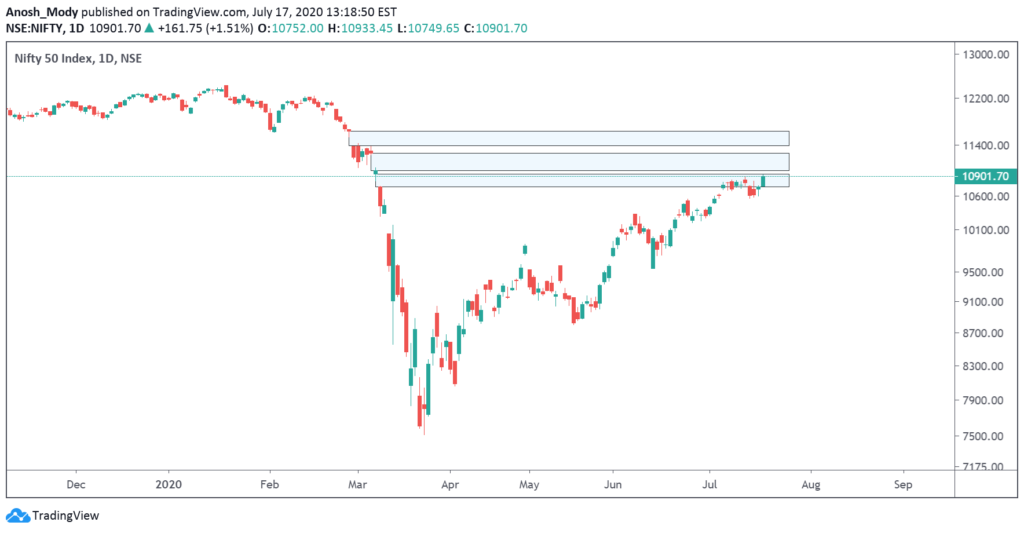
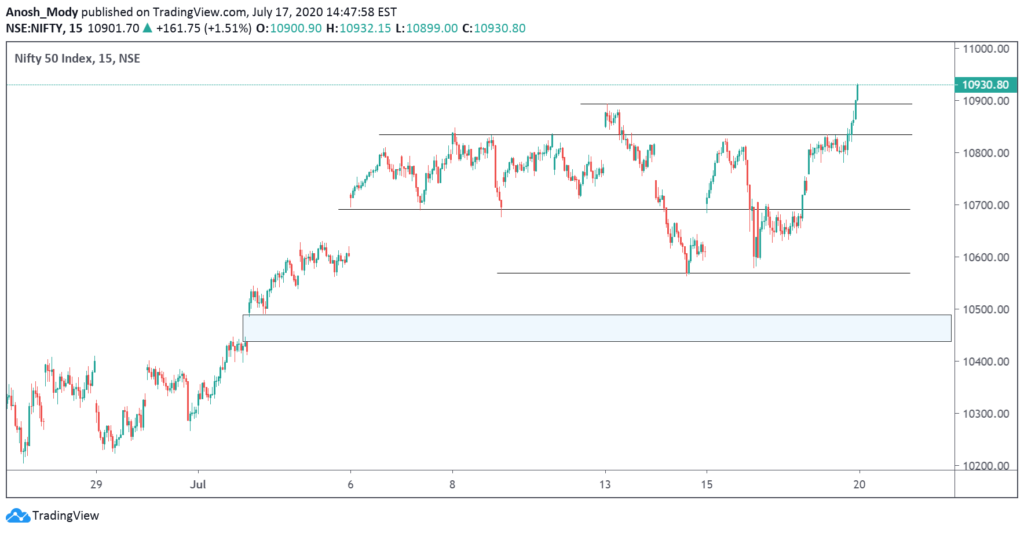
i. Closed above a crucial zone and closed a major gap of 9th March
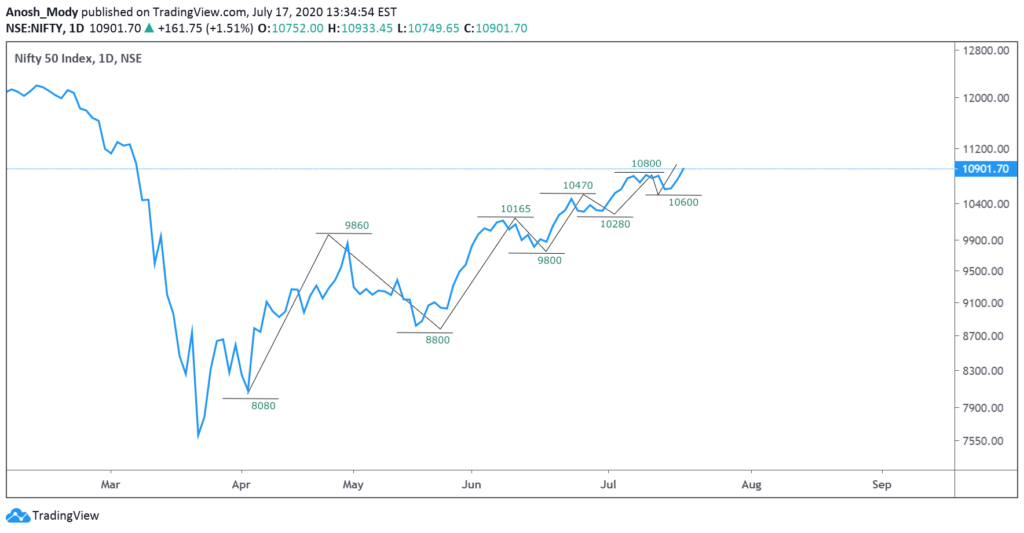
Uptrend is still intact; Formed a higher low at 10600 and took out the previous higher high of 10800.
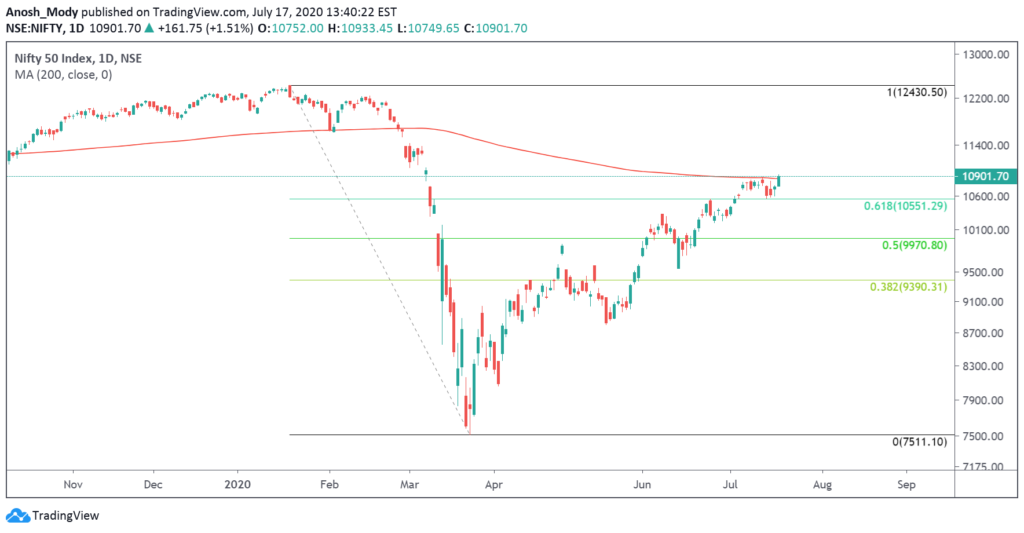
Retested the 61.8% fib and then closed slightly above 200 DMA on Friday.
Sustaining this level can bring good bullish momentum and a swift rise till 11250 and 11630 in the coming weeks!
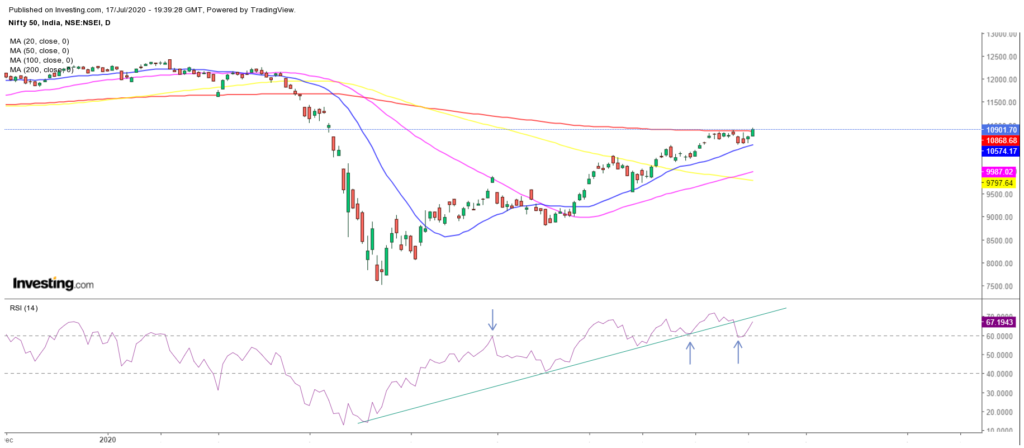
Moving Averages
A quick snapshot of how the major Moving Averages are placed on the daily chart, as well as a look at the RSI indicator.
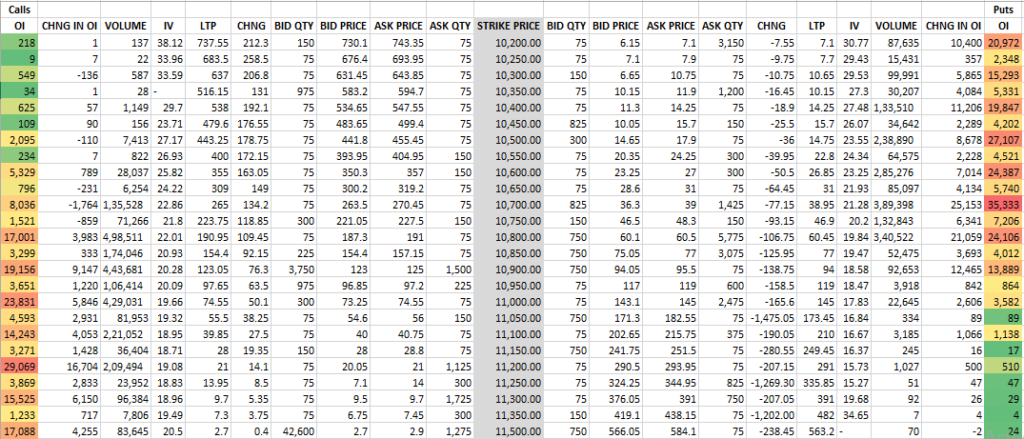
Open interest or OI is the total number of open positions in the market. A high OI indicates that there is a lot of activity in that instrument. It does not indicate buyers and sellers individually but is instead a more holistic measure, i.e. it is the number of contracts between the buyers and sellers, not the buyers and sellers on their own. One of the ways OI analysis works is that high-volume market participants would have sold strangles at strikes which leads to higher OI. This type of reading does not typically account for other types of spreads that one may trade, but the data for it is available.
Looking at the OI figures of 23th July 2020 expiry, we can see that the range is slated to be between 10,700 and 11,200. However, similar to last expiry, the OI at these strikes is not that high. In fact, the strikes at either extreme ends have quite low premiums which doesn’t attract writers.
However, unlike the last expiry, the range ahead is not that wide at just around 500 points.
Last week’s range of between 10673-10857 has been broken and as long as it is sustained, we could see positive moves ahead.
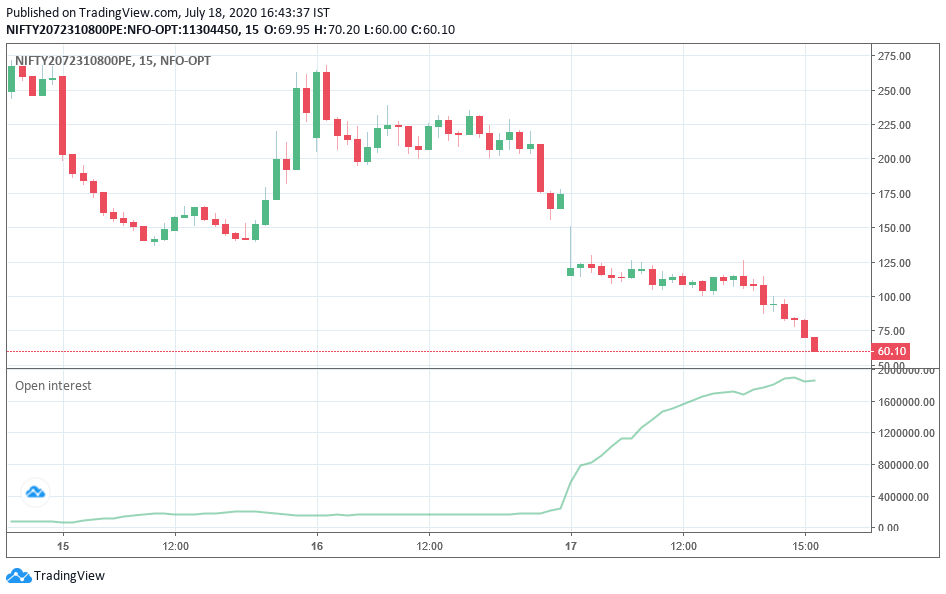
Looking at the Open Interest charts of the high-OI strikes, we can see that call writing is quite significant at higher levels of 11200. We can see how drastically the prices of this option have fallen with an increase in open interest. Similarly, 10800 put writing is quite evident as well.
Both the options show fairly drastic moves because until Friday, we were seeing very range bound movements which meant that the options highlighted today were not attractive strategies just a few days ago.
Heavyweights in the Nifty 50:
Let’s look at some important stocks in Nifty50 that collectively make up around 41.55% of NSE’s flagship broad market index. The analysis is done on both, Daily and Weekly timeframes. Charts displayed are either Daily or Weekly depending on which provides a clearer picture.
The weights used as per the most recent NSE press release available, dated June 30 2020. Compared to the previous period’s, this period has seen an increase in the weightages of the top five Nifty companies we feature.
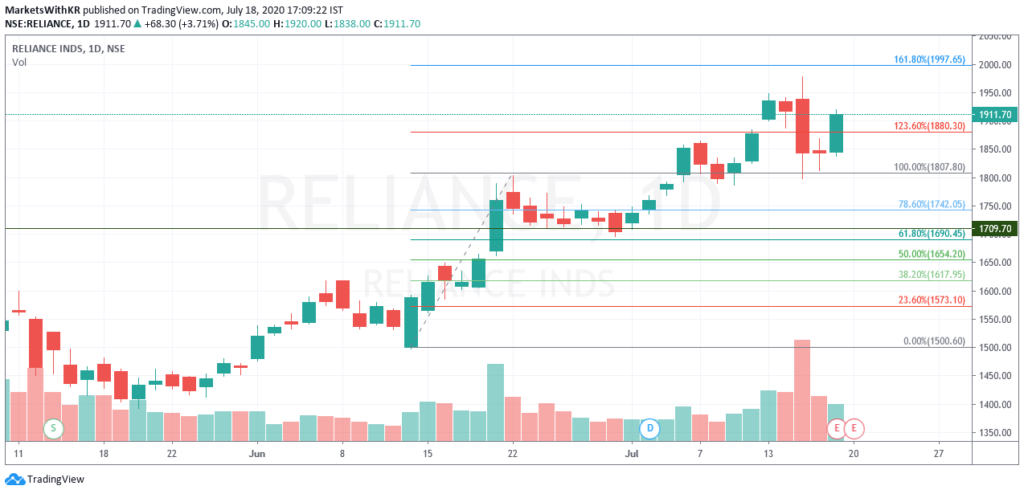
1. Reliance (12.45% weight): This was one of the most eventful weeks for Reliance Industries thanks to the 43rd Annual General Meeting of the company. During the meeting, the price of RIL dipped quite sharply as seen in the Daily chart below. However, after some contemplation at those levels (indicated by the spinning top on Thursday), we saw a very strong recovery, bringing the stock price back to 1900+. Intraday moves did indicate some hesitation overall, with a bearish bias, but that was reversed on Friday towards market close. Our view on Reliance remains to be fairly bullish above levels higher than 1940 (as that could act as the next resistance). 1997 could act as an important barrier as it is the 161.8% Fibonacci extension as well as the 2000 psychological level.
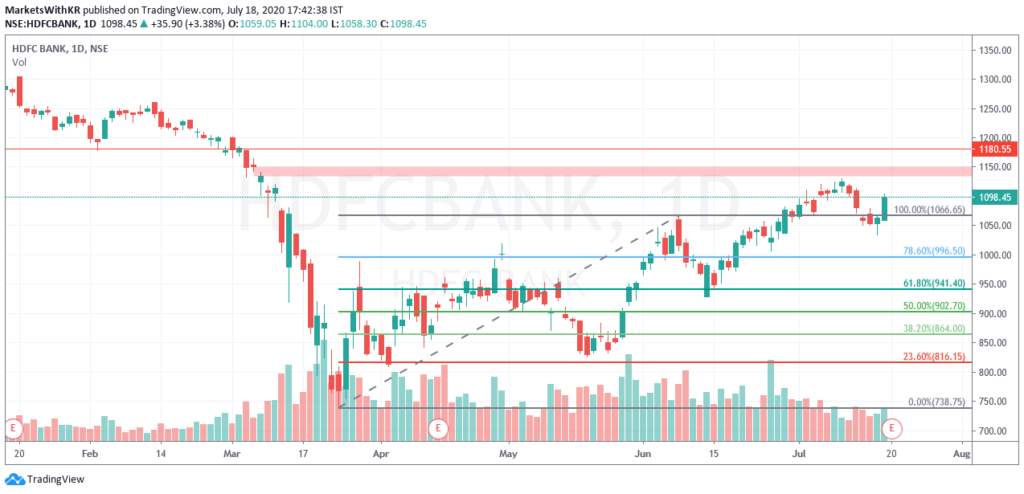
2. HDFC BANK (10.65% weight): After a good uptrend, it experienced some retracement before showing some rather strong moves towards the end of the week just below an important support level. This could also be in anticipation of a strong Q1 Earnings. Said results are quite strong as the bank has reported double-digit growth. If we continue seeing a positive sentiment with HDFC Bank, we could see a minor hurdle between 1135 and 1150 levels, as highlighted in the chart below.
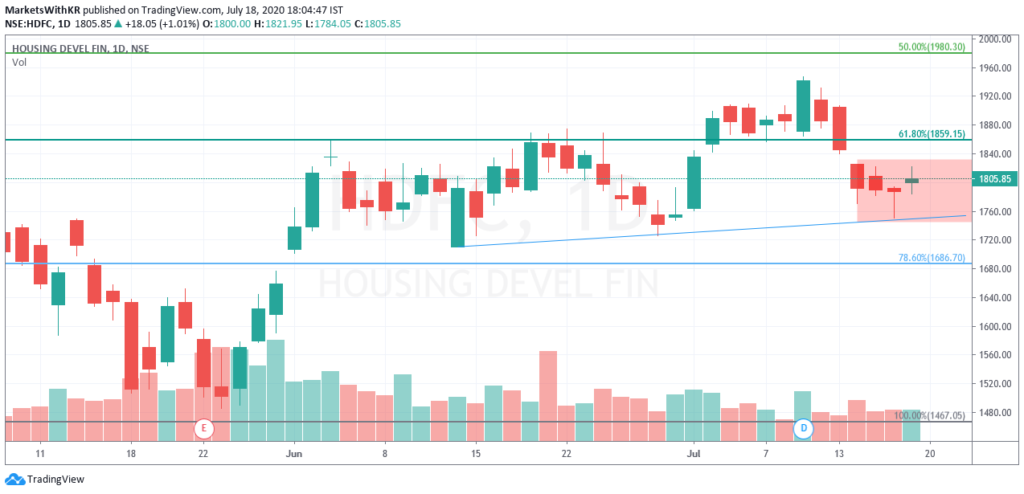
3. HDFC (6.99% weight): The 1865 levels were not respected and we saw some fairly negative moves followed by a sideways movement (highlighted in the chart below). A breach above or below the highlighted area would indicate a larger move incoming towards the next support or resistance levels. It is interesting to note that while HDFC Bank performed fairly well this past week, the same was not true for HDFC. However, it seems in a steady uptrend on a broader view as is seen by the mild trendline.
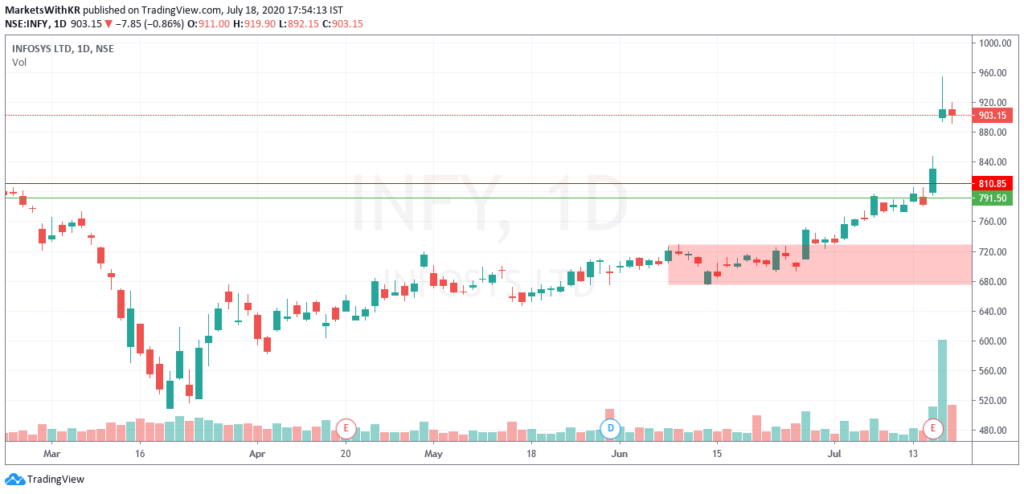
4. Infosys (6.21% weight): After a good run last week, the week ending 17th July was also quite eventful for Infosys. This is thanks to a strong result and an even stronger sentiment in the market. Pre-result day, ADRs were trading 10% up which fuelled the stock further. However, the sign of caution would have been the Thursday closing candle being a shooting star as well as a non-positive Friday candle. Considering this, Infosys is one stock we would be quite cautious about this coming week.
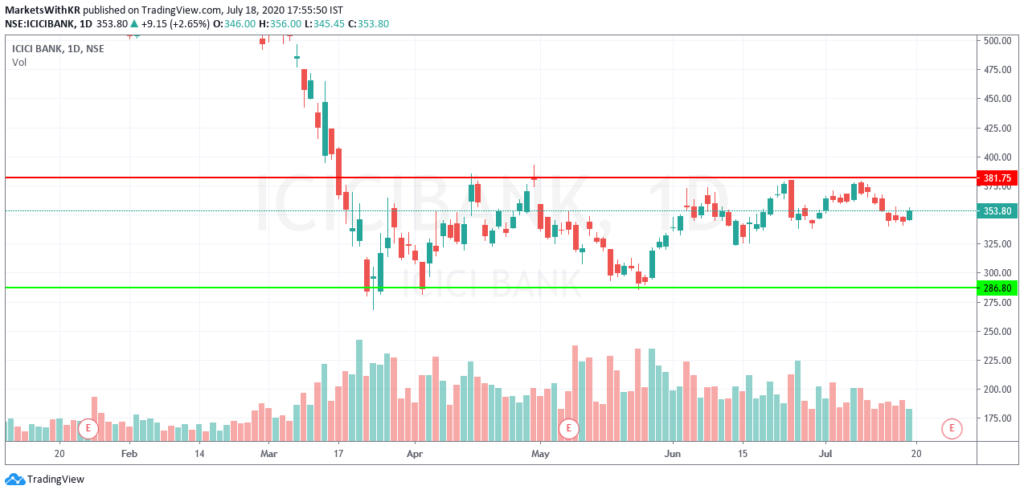
5. ICICI Bank (5.25%): ICICI Bank remains to be one of the weakest stocks in the list. It has been unable to break out of the range that it has been stuck in since the price fell during the initial few days of the COVID-19 outbreak. This is unlike many other stocks (especially large caps) that have managed to recover a fair bit from their swing lows. Our view is quite similar to what it was last week as it really has not moved enough. 381 appears to be a good supply zone for ICICI Bank and until it is able to breach this level, we may not see very decisive positive moves. It is known that the market moves in the way of least resistance, and that appears to be towards 320-340 for this stock as of now, even according to Fibonacci retracement levels that are not pictured below. While the past week was fairly negative, it appears to have taken some support on Friday, and may possibly test higher levels this coming week depending on sentiments. Later this coming week, we may see some moves in anticipation of the company’s earnings announcement on 27th July 2020.
Volatility:
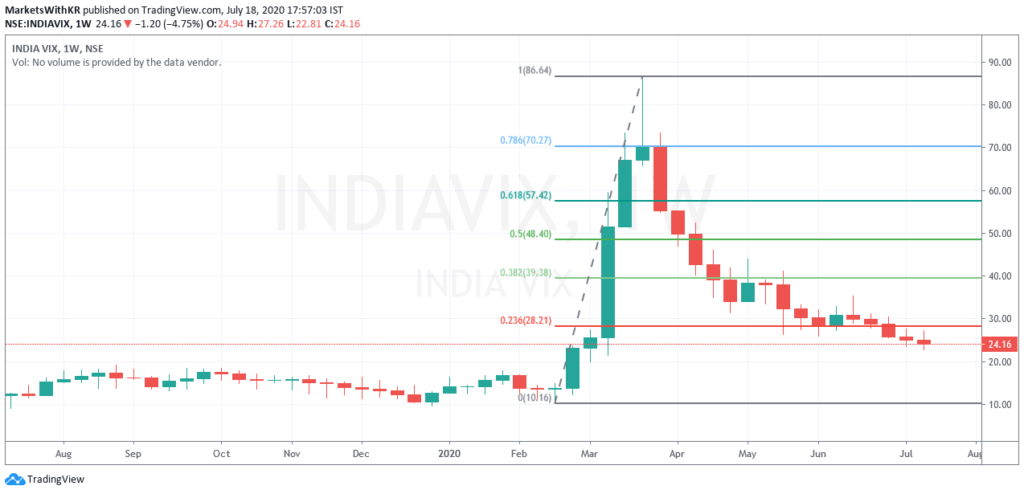
VIX continues to fall, but based on intraday price movements and overall sentiments, we believe that the actual price movements are not very well described by INDIA VIX this time around. If the markets continue climbing a wall of worry, we may continue seeing lower VIX levels, until it doesn’t. When VIX may just spike.
The point we intend to drive here is that VIX does not move solely based on the chart’s support and resistances. Hence, keeping in mind that uncertainty still exists, it would not be appropriate to decisively conclude that VIX is stabilizing.
Additionally, VIX appears to have a support at 20 which may be the next hurdle.
Another point worth considering is that VIX has not been falling as sharply as it did earlier and has effectively stagnated at these levels. This could be a sign of reconsideration or it may be a sign that the volatility has found a comfortable place at these levels and may perhaps hint towards a new normal.
For your reference, a lower VIX (or lower volatility) is generally associated with price moves that are less choppier and more trending. It also results in lower option prices (due to a lower IV). But at the same time, the ATR (Average True Range) of the stock would be narrower.
Disclaimer:
We, Anosh Mody & Krunal Rindani shall take no responsibility for any losses occurring out of investment/trading decisions you make based on the contents of this article.
We are not SEBI registered investment advisors. This article is meant for educational purposes only, please consult your investment advisor before acting upon any information you see here.
We may or may not have open positions, kindly assume that we are biased.


